Profile of People on Mandatory Supervised Release / Parole Status for IDOC
(as of December 31, 2020)
The following information is based upon the Illinois Department of Corrections (IDOC) Parole Population Data Set for December 31, 2020 that is accessible to the public on the IDOC website here.
JHA analyzed the information contained within the data set to create a profile of the Mandatory Supervised Release (MSR)/Parole population of IDOC to increase the public’s understanding about the people who are under IDOC supervision in the community following release from prison as of December 31, 2020. We also used the IDOC data set to generate charts and graphs representing nuanced breakdowns of information related to IDOC’s MSR population, and make comparisons between IDOC’s MSR and prison populations and the MSR population over time (2016 through 2020).
The IDOC Parole Data Set was processed by JHA staff using IBM’s SPSS statistics software. Most of the information in the data set was transformed into the variables presented herein. Details concerning terms and methodology can be found here. Also, detailed information (individual-level data) contained within some categories presented herein can be found here.
(Want to view Prison Population data instead? Click here.)
~subheadIndex-links
Section One: Summary of the Demographic Characteristics of the MSR/Parole Population as of December 31, 2020
1. Age of People on MSR as of December 31, 2020 (n = 23,354*)
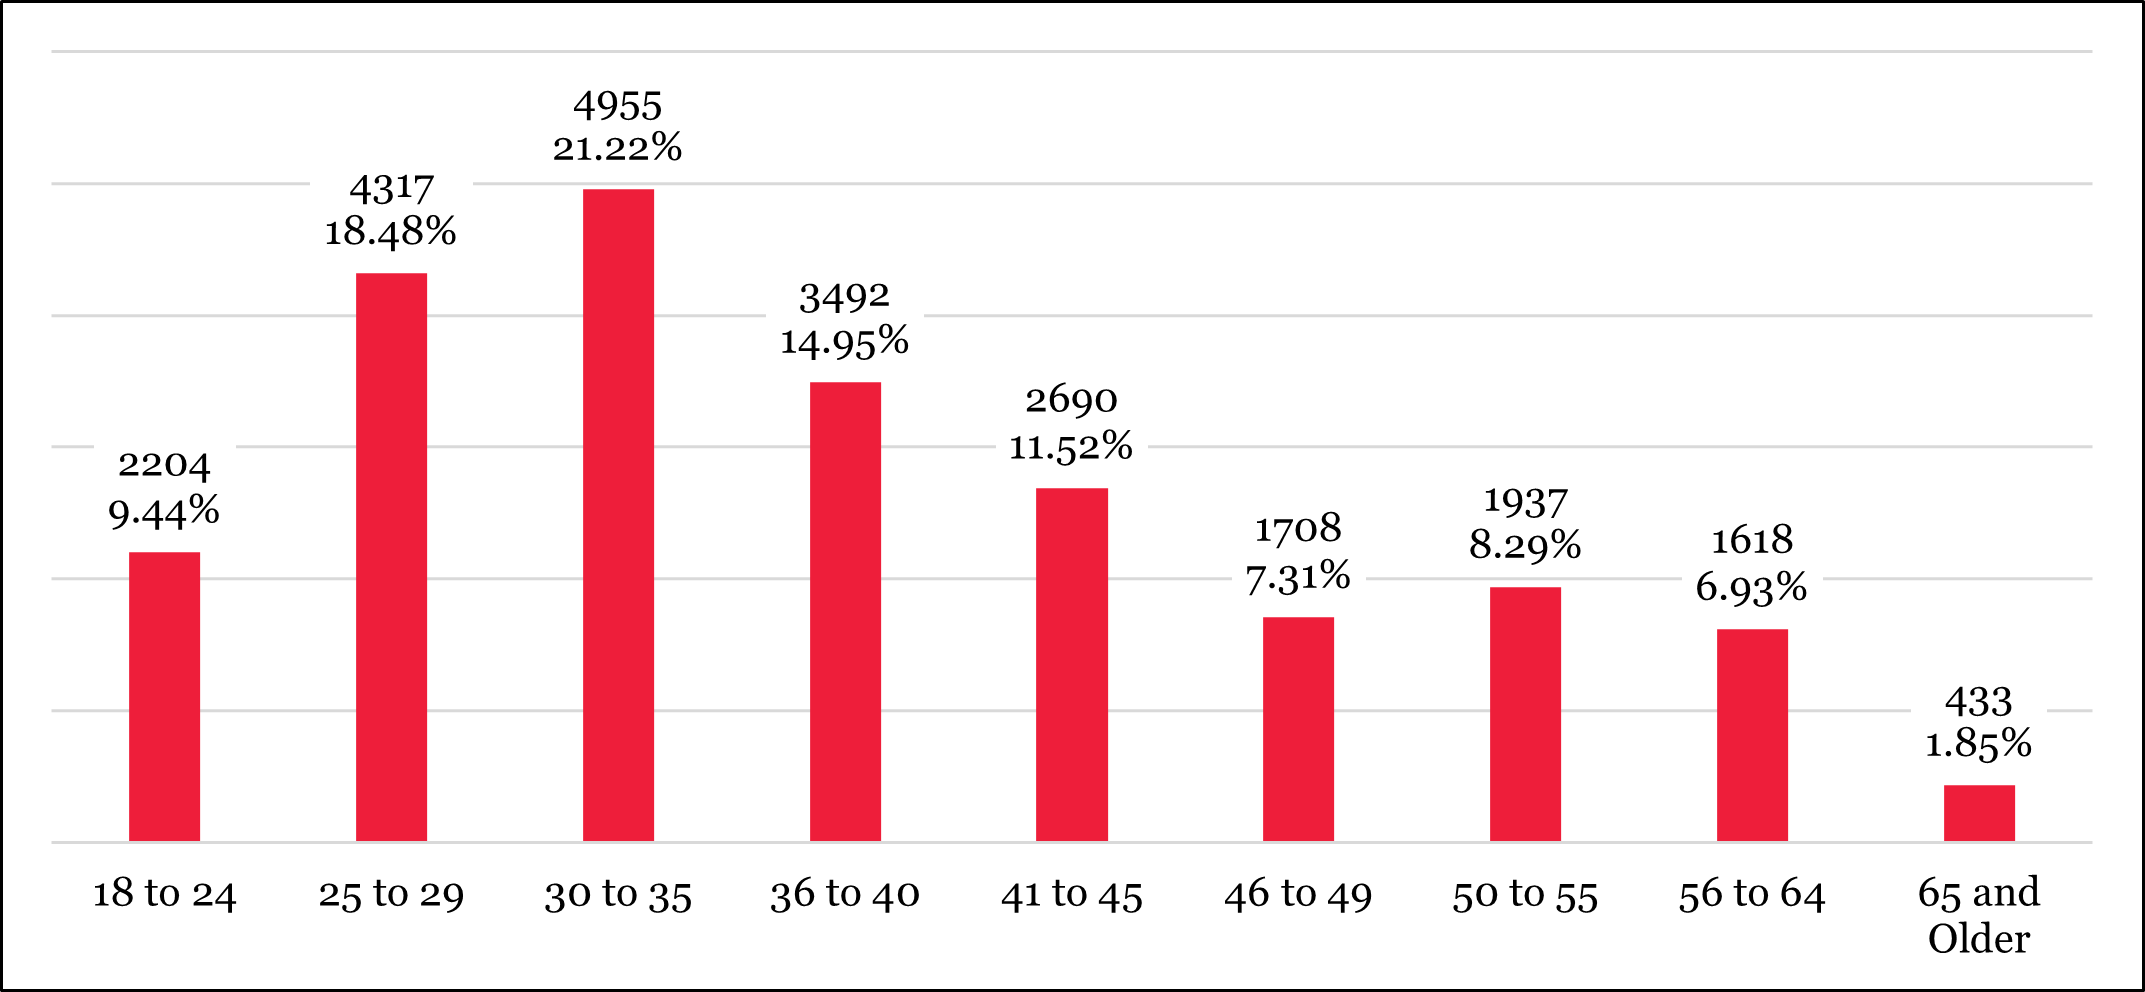
* One person in the IDOC data set does not have a date of birth listed and is therefore not included in the graph above.
The average age of a person on MSR as of December 31, 2020 was 37.82 years old, and the age of these people ranged from 18 to 90 years old. Although the average age was 37.82, only 14.95% of people were in the ‘36 to 40’ age bracket. Approximately half (49.14%) of IDOC’s MSR population were 35 or younger, and the majority (56.82%) of these people were between their late teens (18+) and late 20’s (up to 29). Also, approximately one-third (35.91%) of IDOC’s MSR population were 41 or older, and nearly half (47.56%) of these people were 50 or older.
2. Estimated Age at Custody* (n = 23,354**)***

* Estimated age at custody represents a person’s age when they were likely taken into custody by law enforcement for their holding offense.
** One person in the IDOC data set does not have a date of birth listed and is therefore not included in the graph above.
*** Of the 491 people who were 17 and under at time of custody, 8 were transferred from IDJJ to IDOC MSR supervision.
The estimated age of a person on MSR when they were taken into custody for their holding offense (also likely age at time offense was committed) was 32.73 years old on average, and ranged from 13 to 83 years old. Of IDOC’s MSR population, 46.19% were 29 or younger when taken into custody for their holding offense, and most (59.03%) of these people were under the age of 24. Only 18.78% of people were in the ‘30 to 35’ age bracket in which the estimated age at custody average is included. Also, over one-third (35.02%) of people on MSR were 36 or older when they were taken into custody for their holding offense.
3. Age at Release [from prison] (n = 23,346*)

* The graph above does not include one person whose date of birth is not listed in the IDOC data set and 8 people who were transferred directly from IDJJ supervision to IDOC’s MSR population
The age of a person on MSR upon release from prison was 36.75 years old on average, and ranged from 17 to 86 (n = 23,354). Of IDOC’s MSR population, 15.31% were 50 or older upon release from prison. Only 14.50% of people were in the ‘36 to 40’ age bracket in which the average age at release is included. Over half (52.58%) of IDOC’s MSR population were 35 or younger upon release, and most (60.31%) of these people were 29 or younger.
4. Estimated Age at Discharge [from MSR] (n = 23,354*)

* The graph above does not include one person whose date of birth is not listed in the IDOC data set.
5. Gender (n = 23,355)

6. Race* (n = 23,355)

* In this instance, the following IDOC racial categories were condensed into ‘Other’: American Indian, Asian, Bi-Racial, and Unknown.
Section Two: Summary of Legal Characteristics of the MSR/Parole Population
7. IDOC Admission Types* (n = 23,355)

* The IDOC Admission Types mirror the figures reported in the IDOC data set.
Of the 23,355 people on MSR, 368 (1.58%) were placed onto MSR status without being transferred to an IDOC prison. These people completed the custodial part of their court-imposed prison term in a county jail, and were subsequently placed into IDOC custody as individuals on MSR status. The overwhelming majority (98.42%) of people were released from an IDOC facility onto MSR status.
8. Admission Type—Recidivism* (n = 23,355)

* Categories within the above graph were created by JHA using IDOC admission types. Details as to IDOC admission types used to create these categories can be found here.
9. JHA Offense Type of Holding Offense* (n = 23,355)

The graph above demonstrates that under one-third (32.03%) of people on MSR status have a ‘Person’ offense listed as their holding offense by IDOC, and less than one-third (30.72%) of these people are on MSR for a ‘Person’ offense resulting in death or physical injury as indicated by the statutory language or court finding associated with the holding offense. People whose holding offense was classified by JHA as a ‘Drug’ or ‘Property’ offense combine to make up 39.33% of the MSR population. These offense types are considered by most criminal justice practitioners to be less serious than ‘Person’ or ‘Sex’ offenses.
10. Felony Class of Holding Offense (n = 23,337*)

* Unclassified people are not included in the graph above. All are SDP’s (n = 18).
The largest group of people on MSR status are those whose holding offense is a Class 1 or 2 felony (46.25%). Approximately one-third (32.13%) of people on MSR’s holding offense are either Class 3 or 4 felonies. Approximately one-fifth (21.62%) of people on MSR’s holding offenses are either Class M (murder) or Class X. Typically, the length of a person’s MSR term is determined by the felony class of their holding offense according to statute (730 ILCS 5/5-8-1 (d)). The standard MSR terms by Felony Class as of December 31, 2020 are as follows: Class M and X: 3 years; Class 1 and 2: 2 years; Class 3 and 4: 1 year.
11. Length of Court-Imposed Prison Sentence for Holding Offense (n = 23,317*)

* There are 38 people on MSR who are not included in the graph above: those who are SDP’s (n = 18) and those who were serving a court-imposed sentence of imprisonment for life that was commuted by the Governor of Illinois (n = 20).
The average length of the custodial part of the court-imposed sentence that was served by a person prior to them being released from a prison onto MSR status is 6.81 years and the median length of court-imposed sentence is 4 years if the range of court-imposed sentences is limited to 1 through 100 years (n = 23,281). As court-imposed sentences within the 1 through 100 year range are not normally distributed (skewness: 4.45; kurtosis: 25.10), the proper measure of central tendency to use in this instance is the median of 4 years.
The majority (58.28%) of people on MSR received a court-imposed sentence of less than 5 years of imprisonment followed by a term of MSR. Approximately one-quarter (28.76%) received a court-imposed prison sentence ranging between 5 to 10 years. The remaining 12.96% of people on MSR received a court-imposed prison sentence of greater than 10 years. The overwhelming majority (99.86%) of the 13,588 of people on MSR who received a court-imposed sentence of 5 years or less were imprisoned for a Class 1 through 4 felony offense, most of which are probationable (i.e., a prison sentence was not mandatory).
12. Estimated Length of Court-Imposed Prison Sentence for Holding Offense After “Truth in Sentencing” Multiplier Applied* (n = 23,317**)

* The “Truth in Sentencing” multiplier is determined by law based on the holding offense (730 ILCS 5/3-6-3). A person may be required to serve 100%, 85%, 75%, or 50% of the custodial part of their court-imposed prison sentence preceding a MSR term. Thus, the multipliers are 1, .85, .75, and .5 respectively. A person whose sentence is calculated at 75% or 50% may earn sentencing credits that may reduce the time they are imprisoned for their holding offense. Conversely, a person whose sentence is calculated at 85%, 75%, or 50% may have been required to serve up to 100% of their court-imposed sentence if they had “good time” revoked for violating IDOC rules. Please note that most people are simultaneously serving multiple court-imposed prison sentences, concurrently or consecutively, and this may affect the “Truth in Sentencing” multiplier.
** There are 38 people on MSR who are not included in the graph above: those who are SDP’s (n = 18) and those who were serving a court-imposed sentence of imprisonment for life that was commuted by the Governor of Illinois (n = 20).
The average length of the custodial part of the court-imposed sentence that was served by a person prior to them being released onto MSR status after the “Truth in Sentencing” (TIS) multiplier is applied is 3.90 years and the median length is 2.25 years if the range of court-imposed sentences after the TIS multiplier is applied is limited to 6 months through 100 years (n = 23,307). Thus, after the TIS multiplier is applied to JHA’s “Length of Court-Imposed Prison Sentence for Holding Offense” variable, the average length of sentence decreased by 42.73% and the median length of sentence decreased by 43.75% for people included in this MSR population dataset overall. As court-imposed sentences after the TIS multiplier is applied within the 6 months through 100-year range is not normally distributed (skewness: 6.46; kurtosis: 74.85), the proper measure of central tendency to use in this instance is the median of 2.25 years.
The difference in the proportion of people in the brackets represented in graph 11 compared to graph 12 is likely explained by the existence of a correlation between TIS and length of court-imposed sentence. People who are subjected to a court-imposed sentence of 10 years or less are more likely to have their sentence calculated by IDOC at “day-for-day” (i.e., 50%) by operation of law upon admission to IDOC, while people who are serving harsher court-imposed sentences (longer than 10 years) are more likely to have their sentence calculated by IDOC at 85% or 100% by operation of law upon admission to IDOC.
Comparing the graphic above to the graph representing length of court-imposed sentence alone (Graph 11), there is a substantial increase of the proportion of people who fall into the ‘2 years or less’ bracket after TIS was factored into length of court-imposed sentences (48.95% versus 18.48%). Thus, after TIS was factored into the length of the custodial part of the court-imposed sentence preceding a person’s MSR term, nearly half (48.95%) of people on MSR were actually sentenced to serve 2 years or less in prison.
13. Length of Time Served in Prison/Jail for Holding Offense Prior to MSR (n = 23,355)

The average number of months a person on MSR was incarcerated prior to release is 48.35 (appx. 4 years) and the median number of months incarcerated is 27.32 months (appx. 2 years, 3 months). As the length of time people on MSR were incarcerated in a prison and/or jail for their holding offense prior to MSR in months is not normally distributed (skewness: 3.60; kurtosis: 16.47), the proper measure of central tendency to use in this instance is the median of 27.32 months.
14. Subject to “Truth in Sentencing” for Holding Offense (n = 23,317*)

* There are 38 people on MSR who are not included in the graph above: those who are SDP’s (n = 18) and those who were serving a court-imposed sentence of imprisonment for life that was commuted by the Governor of Illinois (n = 20).
** People subject to 50% (i.e., day-for-day) or 75% TIS may earn sentencing credits reducing the amount of time they are imprisoned. Also, these people may serve more than 50% or 75% of their sentences respectively as the result of being sanctioned for a serious IDOC rule violation and other factors.
*** People subject to 85% or 100% TIS are prohibited by law from earning sentence credits that will result in a reduction of their court-imposed sentence. People required to serve 85% of their sentence may serve more than 85% as the result of being sanctioned for a serious IDOC rule violation and other factors. People under 100% TIS and cannot have their sentence extended because they have no “good time” that can be revoked.
A large majority (87.04%) people on MSR were required to serve 50% (i.e., day-for-day) of the custodial part of their court-imposed sentence. Less than one percent of people on MSR were under 100% TIS while serving the custodial part of their court-imposed prison sentence.
15. Time Served on MSR as of 12-31-2020 (n = 22,949*)

* 406 people identified whose projected discharge date occurred prior to December 31, 2020 are not included in the graph above.
Of the people on MSR status who meet the condition of having a projected discharge date that occurs after December 31, 2020 (n = 21,949), the average number of months of MSR they have served is 12.24 (appx. 1 year) and the median number of months of MSR they have served is 9.63 months. As time served by people on MSR in months is not normally distributed (skewness: 8.02; kurtosis: 211.68), the proper measure of central tendency to use in this instance is the median of 9.63 months.
Of the people on MSR status who meet the condition of having a projected discharge date that occurs after December 31, 2020, the majority (62.07%) have served less than one year of MSR after release from prison, nearly a one-fourth (27.28%) have served one year to two years of MSR, and the remaining 10.65% have served more than two years of MSR.
16. Estimated Time Until Discharge from MSR* (n = 23,355)

* People included in the Negative Value category include people whose projected discharge date occurs prior to December 31, 2020.
Of the people on MSR status who meet the condition of having a projected discharge date that occurs after December 31, 2020 (negative values in the graph above), not serving an indeterminate MSR term, or a person whose discharge date is not beyond four years (n = 21,992), the average number of months until they may be discharged from MSR is 14.22 (appx. 1 year and 2 months) and the median number of months until they may be discharged from MSR is 11.70 months (appx. 1 year).
Of the total number of people on MSR (n = 23,355), 11,232 (48.09%) of these people should have less than one year of remaining on their MSR term, while 11,717 (50.17%) should have one year or more remaining on their MSR term.
17. County Where Person was Sentenced for Holding Offense—Regional* (n = 23,355)

* A listing of counties included in each region can be found here.
18. County Where Person on MSR Resides—Regional* (n = 23,355)

* A listing of counties included in each region can be found here.
19. County of Residence—Sentencing County Match (n = 23,355)
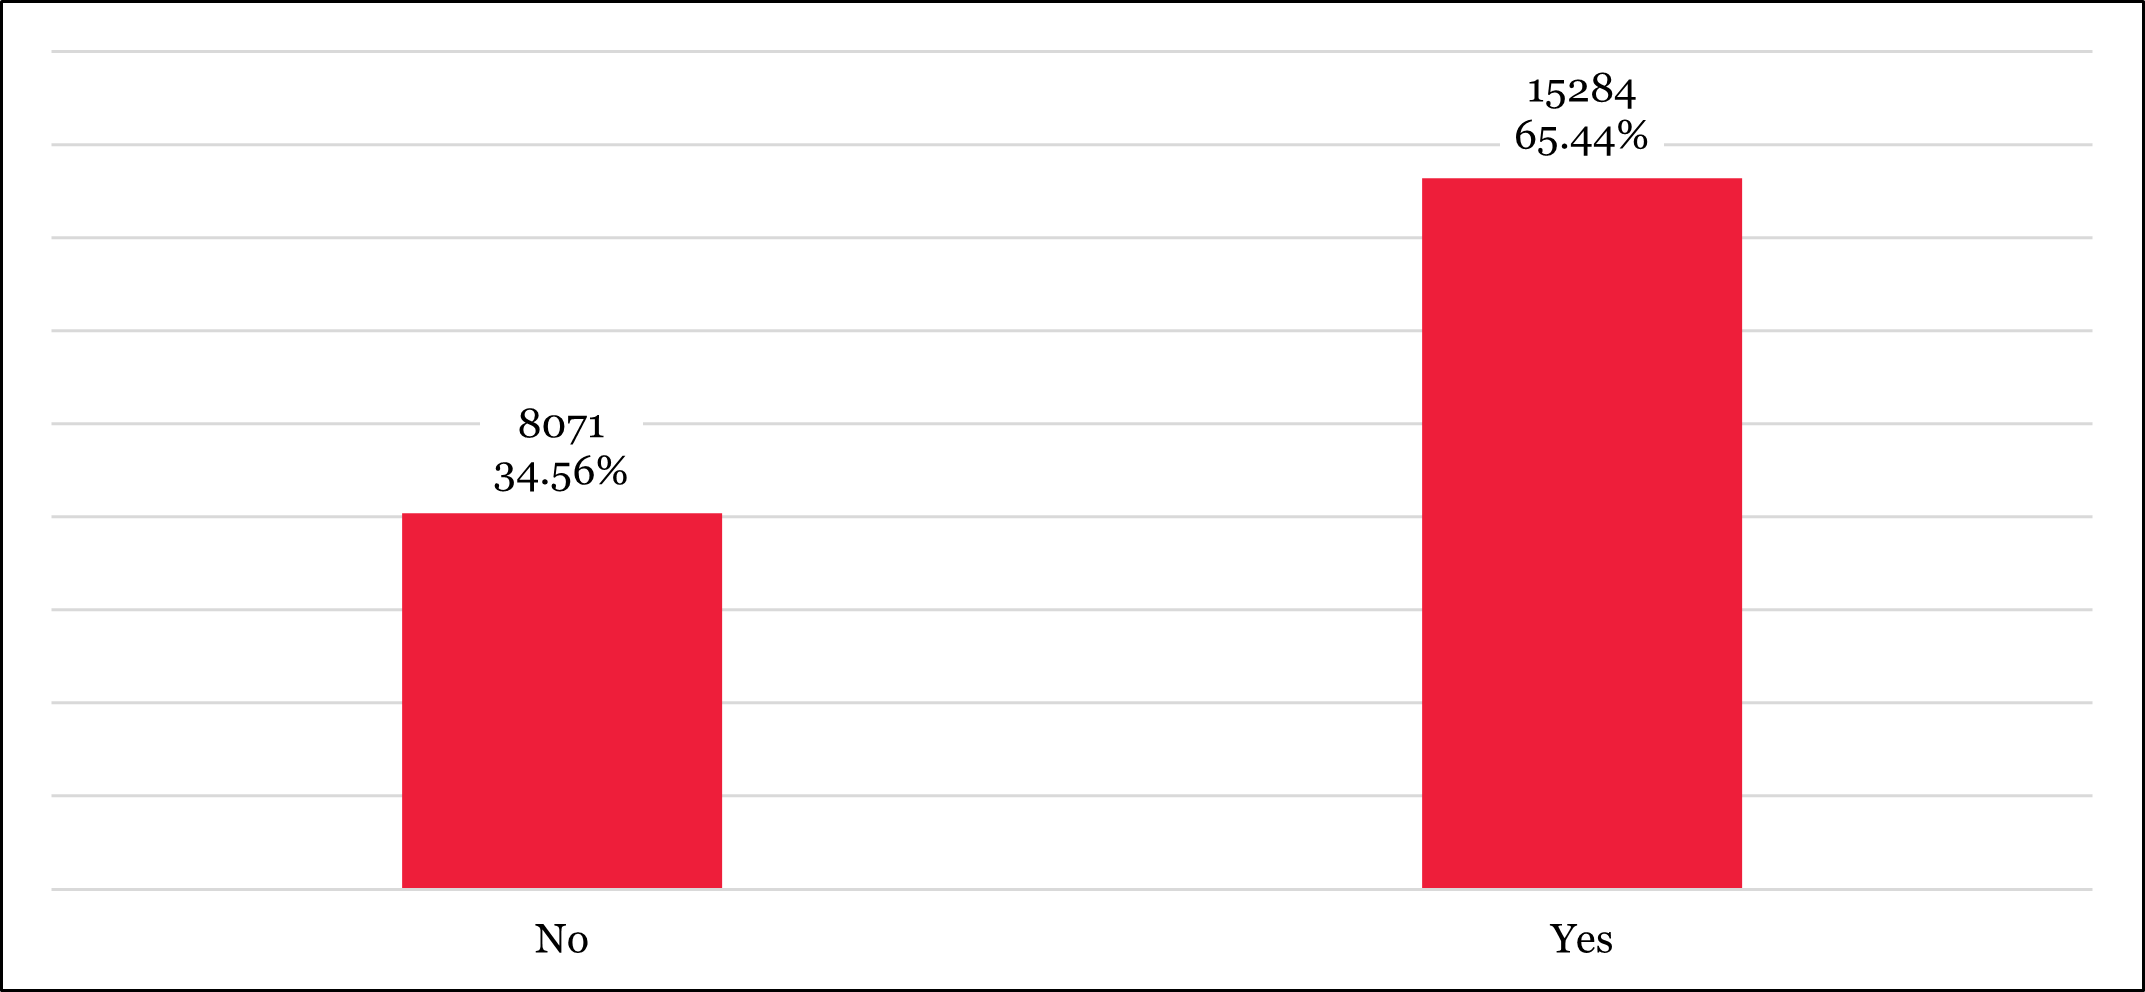
Of the MSR population, 8,071 (34.56%) people did not reside in the county in which they were sentenced for their holding offense as of December 31, 2020, while the majority (65.44%) did reside in the county in which they were sentenced for their holding offense as of December 31, 2020.
The following is a regional breakdown of the 8,071 people on MSR who resided in a county other than the county in which they were sentenced, meaning they either relocated to the region* indicated below after release from prison or resided in the indicated region prior to being sentenced in another region for their holding offense:
Cook: 1,518 (18.81%)
Chicago Metro—Suburbs: 1,032 (12.79%)
St. Louis Metro—Suburbs: 329 (4.08%)
Northern IL—North of I-80: 786 (9.74%)
Central IL—Between I-80 & I-70: 2,113 (26.18%)
Southern IL—South of I-70: 625 (7.74%)
Out of State: 1,668 (20.67%)
* A listing of counties included in each region can be found here.
Section Three: Comparison of IDOC’s Static MSR and Prison Populations as of 12/31/20
The graphs contained within this section illustrates the similarities and differences between the IDOC MSR and prison populations by using the IDOC prison population as of 12/31/20 as a comparison group.
20. Age of People in Prison versus People on MSR* as of December 31, 2020

* Percentages in each row (Prison Pop & MSR Pop) total to 100%
21. Estimated Age at Custody* of People in Prison versus People on MSR**

* Estimated age at custody represents a person’s age when they were likely taken into custody by law enforcement for their holding offense.
** Percentages in each row (Prison Pop & MSR Pop) total to 100%
22. Estimated Age at Release of People in Prison* versus Age at Release [from prison] of People on MSR**

* Estimated age at release represents how old a person should be when released from prison; the ‘Unknown’ category includes people in prison who do not have a Projected MSR or Discharge date listed by IDOC and SDP’s (people who are civilly committed to the custody of IDOC as a Sexually Dangerous Person—they do not have determinate release dates).
** Percentages in each row (Prison Pop & MSR Pop) total to 100%
23. Gender of People in Prison versus People on MSR*
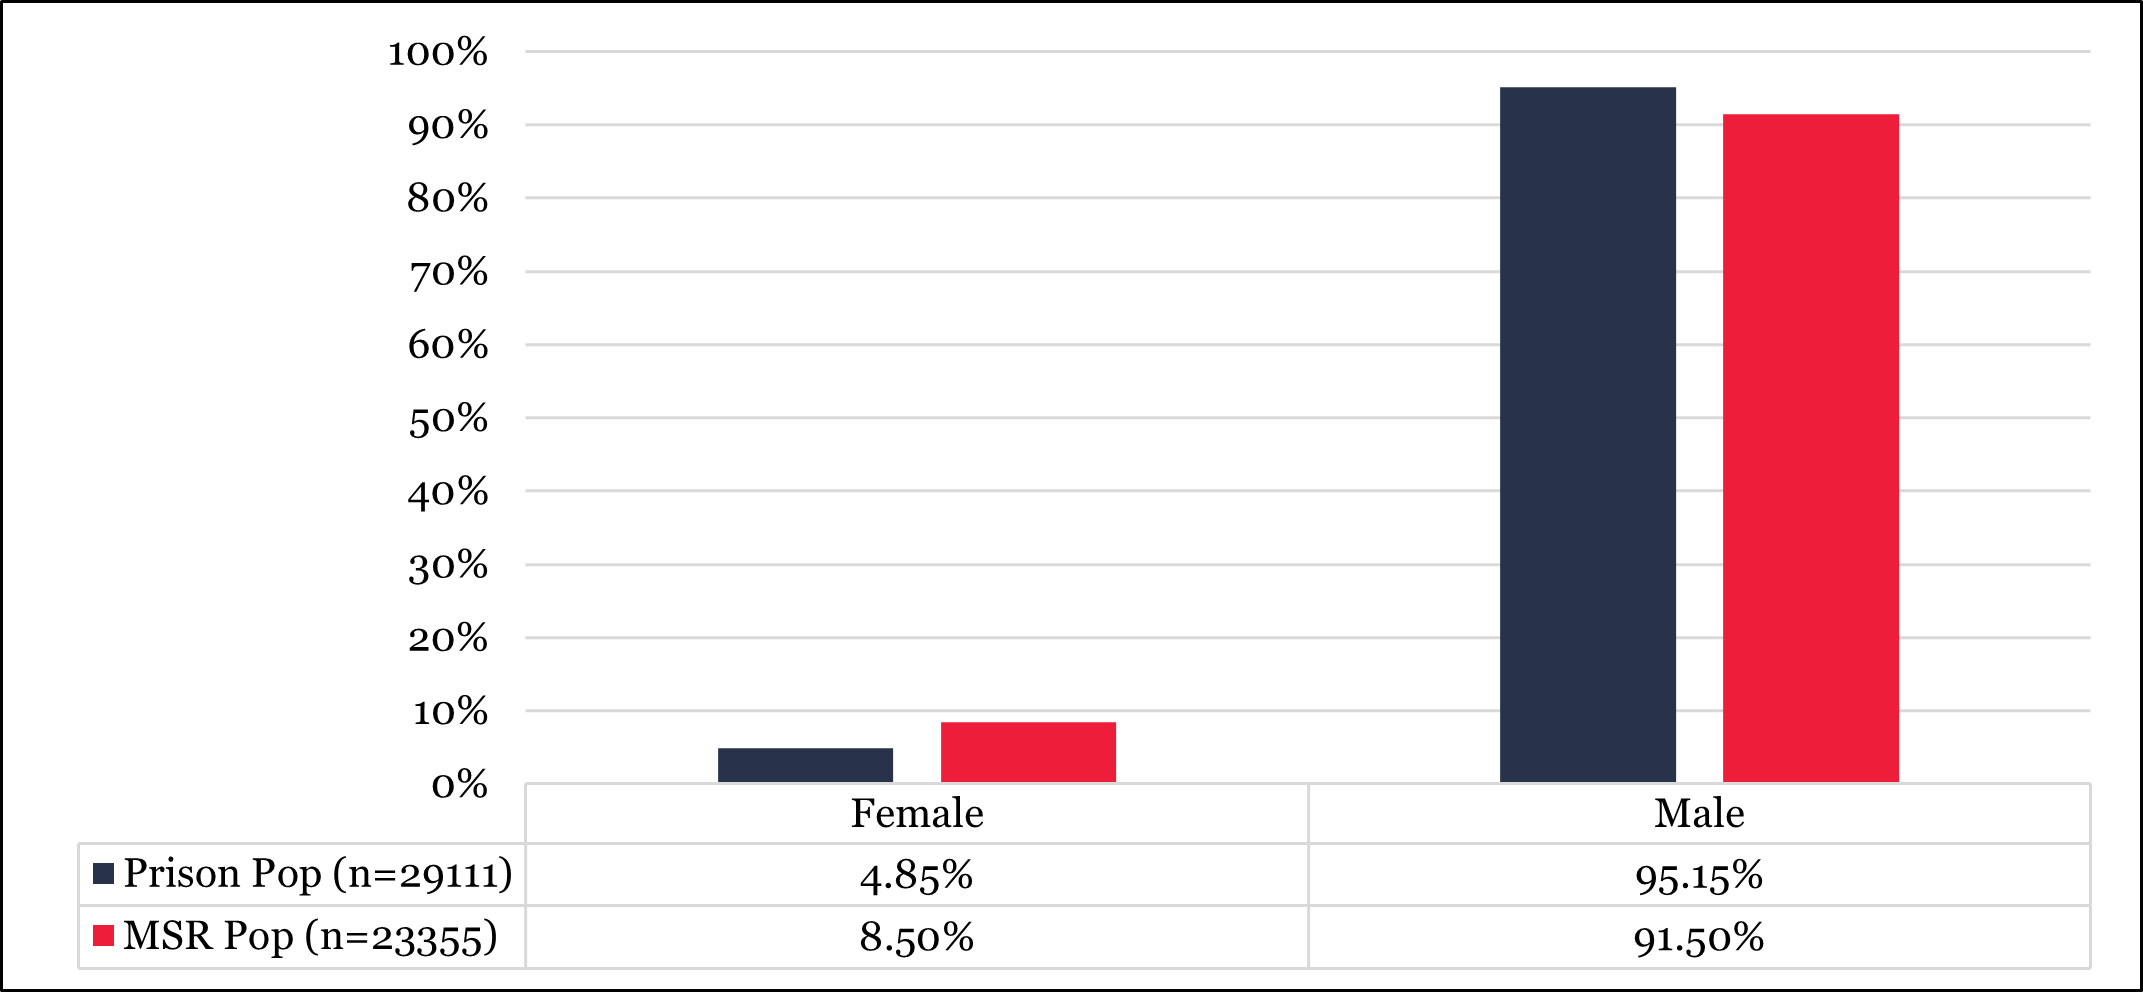
* Percentages in each row (Prison Pop & MSR Pop) total to 100%
24. Race of People in Prison versus People on MSR*

* Percentages in each row (Prison Pop & MSR Pop) total to 100%
25. IDOC Admission Types of People in Prison versus People on MSR*

* Percentages in each row (Prison Pop & MSR Pop) total to 100%
26. Admission Type—Recidivism of People in Prison versus People on MSR*

* Percentages in each row (Prison Pop & MSR Pop) total to 100%
27. JHA Offense Type of Holding Offense of People in Prison versus People on MSR*

* Percentages in each row (Prison Pop & MSR Pop) total to 100%
28. Felony Class of Holding Offense of People in Prison* versus People on MSR**

* People in prison (n=160) and people on MSR (n=18) who are unclassified are not included in the figures above. The majority (98.88%) of the unclassified people are Sexually Dangerous Persons civilly committed to IDOC custody.
** Percentages in each row (Prison Pop & MSR Pop) total to 100%
29. Length of Court-Imposed Prison Sentence for Holding Offense for People* in Prison versus People on MSR**

* People in prison (n=160) and people on MSR (n=18) who are unclassified are not included in the figures above. The majority (98.88%) of the unclassified people are Sexually Dangerous Persons civilly committed to IDOC custody.
** Percentages in each row (Prison Pop & MSR Pop) total to 100%
30. Estimated Length of Court-Imposed Prison Sentence for Holding Offense After “Truth in Sentencing” Multiplier Applied* for People** in Prison versus People on MSR***

* The “Truth in Sentencing” multiplier is determined by law based on the holding offense (730 ILCS 5/3-6-3). A person may be required to serve 100%, 85%, 75%, or 50% of the custodial part of their court-imposed prison sentence preceding a MSR term. Thus, the multipliers are 1, .85, .75, and .5 respectively. A person whose sentence is calculated at 75% or 50% may earn sentencing credits that may reduce the time they are imprisoned for their holding offense. Conversely, a person whose sentence is calculated at 85%, 75%, or 50% may have been required to serve up to 100% of their court-imposed sentence if they had “good time” revoked for violating IDOC rules. Please note that most people are simultaneously serving multiple court-imposed prison sentences, concurrently or consecutively, and this may affect the “Truth in Sentencing” multiplier.
** People in prison (n=160) and people on MSR (n=18) who are unclassified are not included in the figures above. The majority (98.88%) of the unclassified people are Sexually Dangerous Persons civilly committed to IDOC custody.
*** Percentages in each row (Prison Pop & MSR Pop) total to 100%
31. Subject to “Truth in Sentencing” for Holding Offense for People in Prison versus People on MSR*

* Percentages in each row (Prison Pop & MSR Pop) total to 100%
32. County Where Person was Sentenced for Holding Offense—Regional for People in Prison versus People on MSR*

* Percentages in each row (Prison Pop & MSR Pop) total to 100%
Section Four: Comparison of IDOC’s MSR Population by Year, 2016 – 2020
33. Total Static IDOC and MSR Populations as of December 31, 2016 – 2020

34. Age of People on MSR as of December 31, 2016 – 2020*

* All columns (each year) total to 100%
35. Estimated Age at Custody of People on MSR* 2016 – 2020**

* Many people on MSR are not accounted for in the graph above for 2016 (n = 1,225) and 2017 (n = 1,117). The majority of these people transferred into IDOC MSR supervision from another state and their custody date is not listed in the applicable IDOC data set.
** All columns (each year) total to 100%
36. Age at Release [from prison] of People on MSR* 2016 – 2020**

* People on MSR who were transferred from “juvenile parole” to IDOC’s MSR caseload are not accounted for in the graph above.
** All columns (each year) total to 100%
37. Estimated Age at Discharge [from MSR] of People on MSR* 2016 – 2020**

* For the graph above, all people on MSR who did not have a “Projected Discharge Date” listed in the applicable IDOC data set are classified as ‘Indeterminate’ for the “Estimated Age at Discharge” variable.
** All columns (each year) total to 100%
38. Gender of People on MSR 2016 – 2020*

* All columns (each year) total to 100%
39. Race of People on MSR 2016 – 2020*

* All columns (each year) total to 100%
40. Admission Type—Recidivism of People on MSR 2016 – 2020*

* All columns (each year) total to 100%
41. JHA Offense Type of Holding Offense* of People on MSR 2016 – 2020**

* In the years 2016 and 2017, IDOC listed people on MSR who transferred to Illinois in the applicable parole population data sets (i.e., they are on post-release supervision status for a court-imposed sentence imposed in another state). IDOC stopped listing such people in the parole population data sets after 2017, but this cohort of the MSR population exists.
** All columns (each year) total to 100%
42. Felony Class* of Holding of People on MSR 2016 – 2020**

* People on MSR who are ‘unclassified’ are not included in the graph above. The majority (appx. 98%) of these people are from out of state in 2016 and 2017 and the remainder are SDPs. In 2018 through 2020; the unclassified people are limited to SDPs.
** All columns (each year) total to 100%
43. Length of Court-Imposed Prison Sentence* for Holding Offense of People on MSR** 2016 - 2020***

* Court-imposed prison sentence in this instance refers to the prison term preceding the MSR term people included in this analysis were serving as of December 31, 2020. An MSR term follows any term of imprisonment in IDOC in Illinois.
** People on MSR who did not serve a determinate prison term or whose sentence length is not available are not included in the graph above. The majority (appx. 98%) of these people are from out of state in 2016 and 2017 and the remainder are SDPs. In 2018 through 2020, these people are limited to SDPs people who had a court-imposed life sentence commuted by the Governor of Illinois.
*** All columns (each year) total to 100%
44. Length of Court-Imposed Prison Sentence* for Holding Offense After “Truth in Sentencing” Multiplier Applied** of People on MSR*** 2016 - 2020****

* Court-imposed prison sentence in this instance refers to the prison term preceding the MSR term people included in this analysis were serving as of December 31, 2020. An MSR term follows any term of imprisonment in IDOC in Illinois.
** The “Truth in Sentencing” multiplier is determined by law based on the holding offense (730 ILCS 5/3-6-3). A person may be required to serve 100%, 85%, 75%, or 50% of the custodial part of their court-imposed prison sentence preceding a MSR term. Thus, the multipliers are 1, .85, .75, and .5 respectively. A person whose sentence is calculated at 75% or 50% may earn sentencing credits that may reduce the time they are imprisoned for their holding offense. Conversely, a person whose sentence is calculated at 85%, 75%, or 50% may have been required to serve up to 100% of their court-imposed sentence if they had “good time” revoked for violating IDOC rules. Please note that most people are simultaneously serving multiple court-imposed prison sentences, concurrently or consecutively, and this may affect the “Truth in Sentencing” multiplier.
*** People on MSR who did not serve a determinate prison term or whose sentence length is unknown (out of state) are not included in the graph above. The majority (appx. 98%) of these people are from out of state in 2016 and 2017 and the remainder are SDPs. In 2018 through 2020, these people are limited to SDPs people who had a court-imposed life sentence commuted by the Governor of Illinois.
**** All columns (each year) total to 100%
45. Subject to “Truth in Sentencing” for Holding Offense of People on MSR* 2016 – 2020**

* People on MSR who did not serve a determinate prison term or sentence length is unknown (out of state) are not included in the graph above. The majority (appx. 98%) of these people are from out of state in 2016 and 2017 and the remainder are SDPs. In 2018 through 2020, these people are limited to SDPs people who had a court-imposed life sentence commuted by the Governor of Illinois.
** All columns (each year) total to 100%
46. County Where Person was Sentenced for Holding Offense—Regional 2016 – 2020*

* All columns (each year) total to 100%
47. County Where Person on MSR Resides—Regional 2016 – 2020*

* All columns (each year) total to 100%
48. County of Residence—Sentencing County Match 2016 – 2020*

* All columns (each year) total to 100%
Section Five: Detailed Profile of People on MSR as of 12/31/20 by Age
Age represents the age of people on MSR on the day the IDOC data set was generated. The graph immediately following this paragraph illustrates the age of people, grouped into categories, for the entire population of people on MSR status under the supervision of IDOC in the community as of December 31, 2020. It is identical to graph 1 above and is to be used as reference for comparisons between the size of these groups across the IDOC MSR population versus the size of these groups within the categories included in the graphs within this section.
Age of People on MSR as of December 31, 2020 (n = 23,354*)

* One person in the IDOC data set does not have a date of birth listed and is therefore not included in the graph above or the graphs that follow in this section.
Demographic Characteristics of People on MSR Parsed by Age (represented by colored sections within bars)
49. Estimated Age at Custody* Parsed by Age (n = 23,354)

* Estimated Age at Custody (columns in table) total to 100%
50. Age at Release* [from prison] Parsed by Age (n= 23,346**)

* Age at Release (columns in table) total to 100%
** People whose IDOC admission type is ‘Juv parole to adult parole’ (n=8) and one person whose date of birth is not listed are not included in this graph.
51. Gender* Parsed by Age (n = 23,354)

* Gender (columns in table) total to 100%
52. Race* Parsed by Age (n = 23,124**)
* Race (columns in table) total to 100%
** People whose racial identity is other (n=231) are not included in this graph.
Legal Characteristics of People on MSR Parsed by Age (represented by colored sections within bars)
53. Admission Type—Recidivism* Parsed by Age (n = 23,354)

* Admission Type—Recidivism (columns in table) total to 100%
54. JHA Offense Type of Holding Offense* Parsed by Age (n = 23,354)

* JHA Offense Type of Holding Offense (columns in table) total to 100%
55. Felony Class of Holding Offense* Parsed by Age (n = 23,336)

* Felony Class of Holding Offense (columns in table) total to 100%
56. Length of Court-Imposed Prison Sentence for Holding Offense* Parsed by Age (n = 23,336)

* Length of Court-Imposed Prison Sentence for Holding Offense (columns in table) total to 100%
57. Estimated Length of Court-Imposed Prison Sentence for Holding Offense After “Truth in Sentencing” Multiplier Applied* Parsed by Age (n = 23,336)

* Estimated Length of Court-Imposed Prison Sentence for Holding Offense After “Truth in Sentencing” Multiplier Applied (columns in table) total to 100%
58. Length of Time Served in Prison/Jail for Holding Offense Prior to MSR* Parsed by Age (n = 23,354)

* Length of Time Served in Prison/Jail for Holding Offense Prior to MSR (columns in table) total to 100%
59. Subject to “Truth in Sentencing” for Holding Offense Parsed by Age (n = 23,336)

* Subject to “Truth in Sentencing” for Holding Offense After “Truth in Sentencing” Multiplier Applied (columns in table) total to 100%
60. Estimated Time Until Discharge from MSR Parsed by Age (n = 23,354)

* Estimated Time Until Discharge from MSR (columns in table) total to 100%
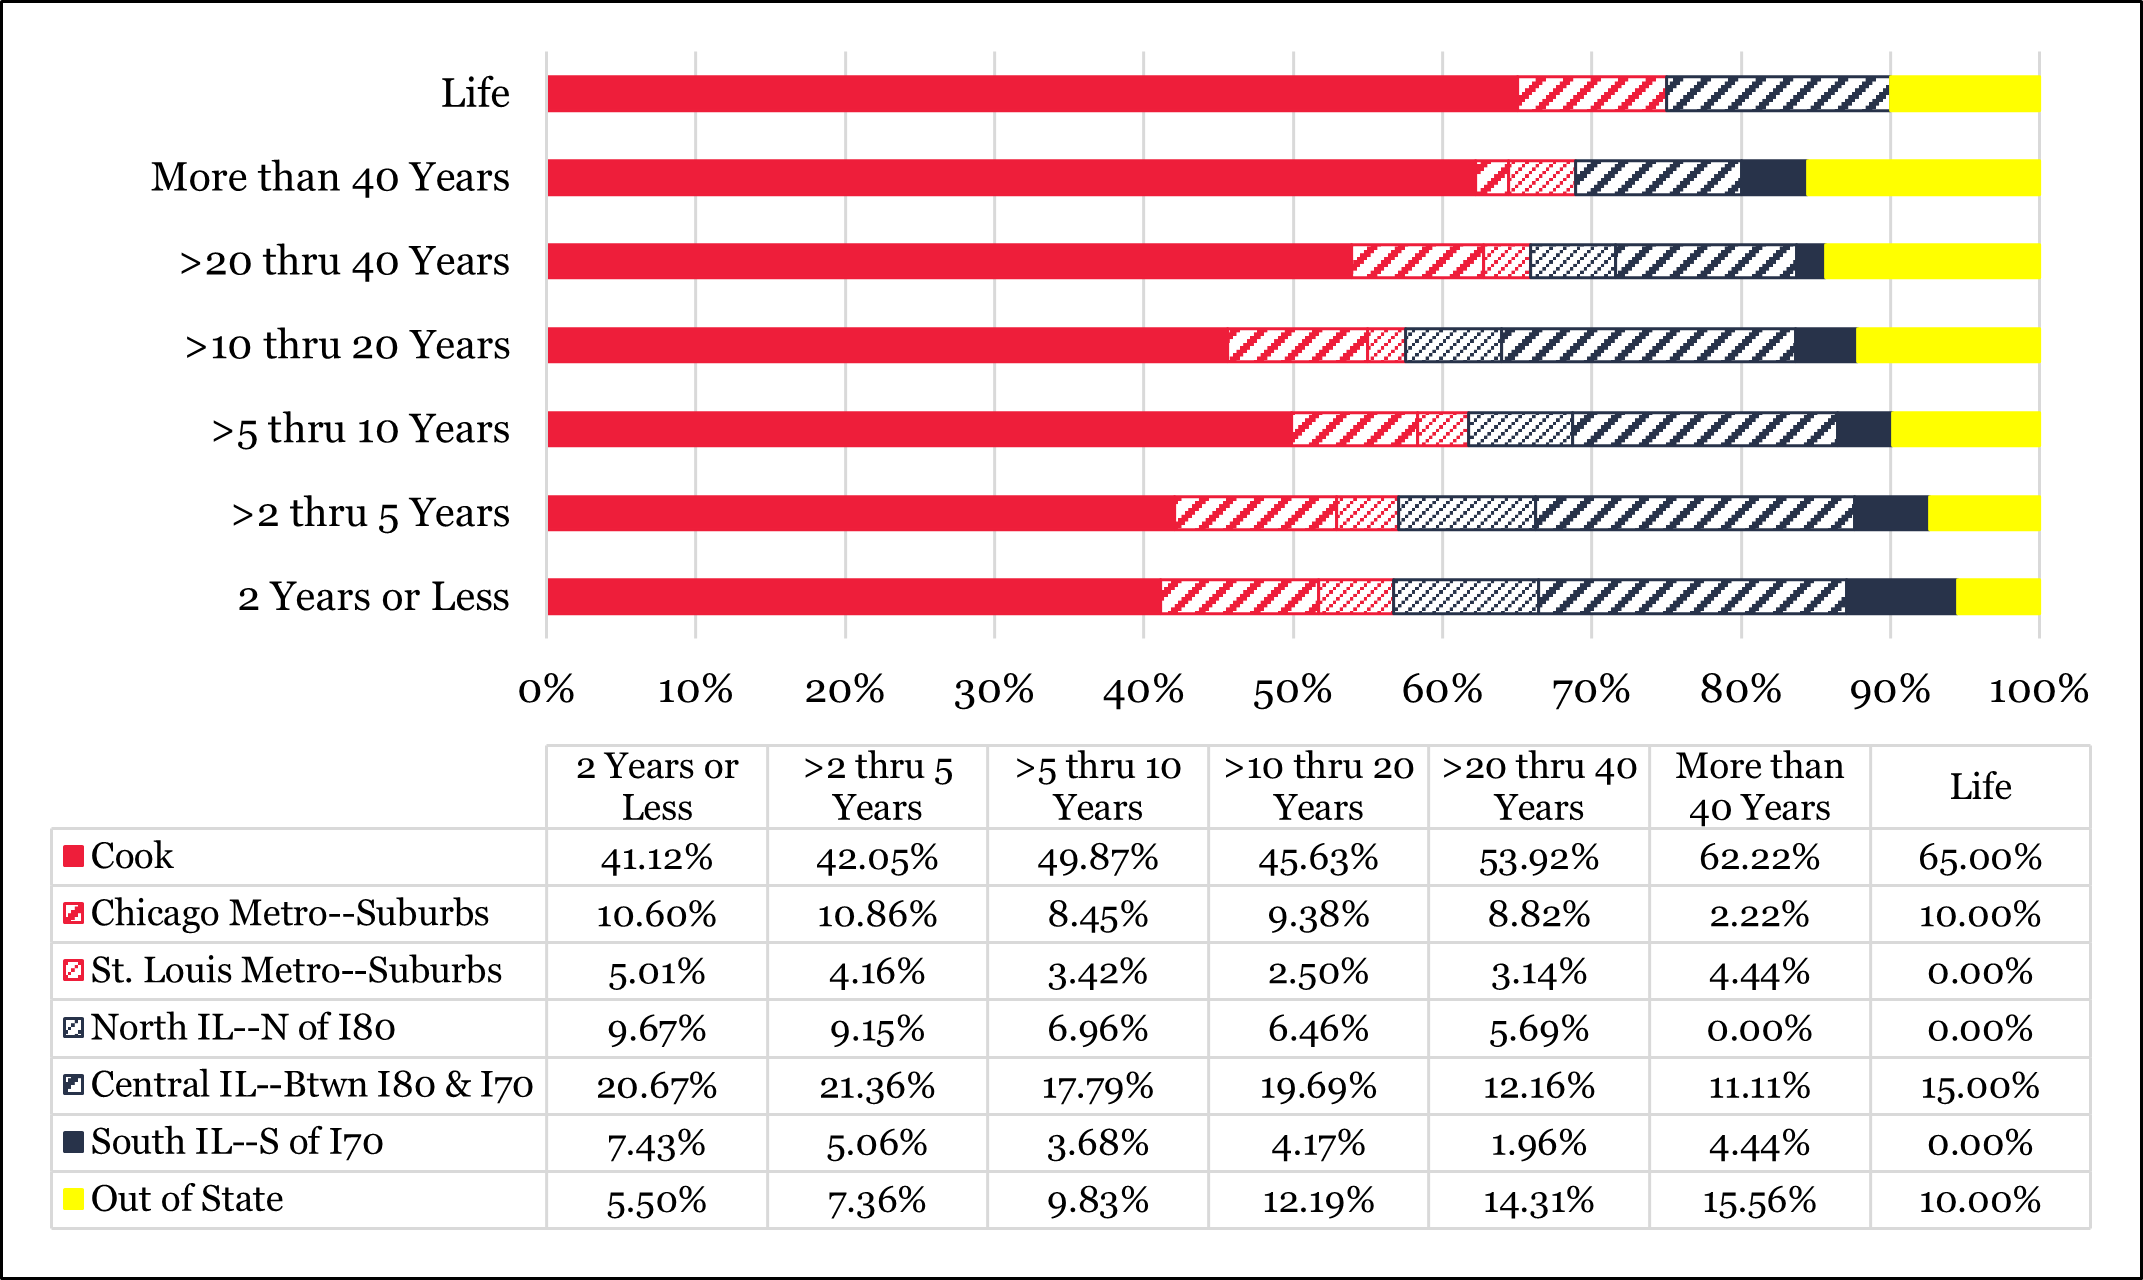
61. County Where Person was Sentenced for Holding Offense—Regional Parsed by Age (n = 23,354)

* County Where Person was Sentenced for Holding Offense—Regional (columns in table) total to 100%
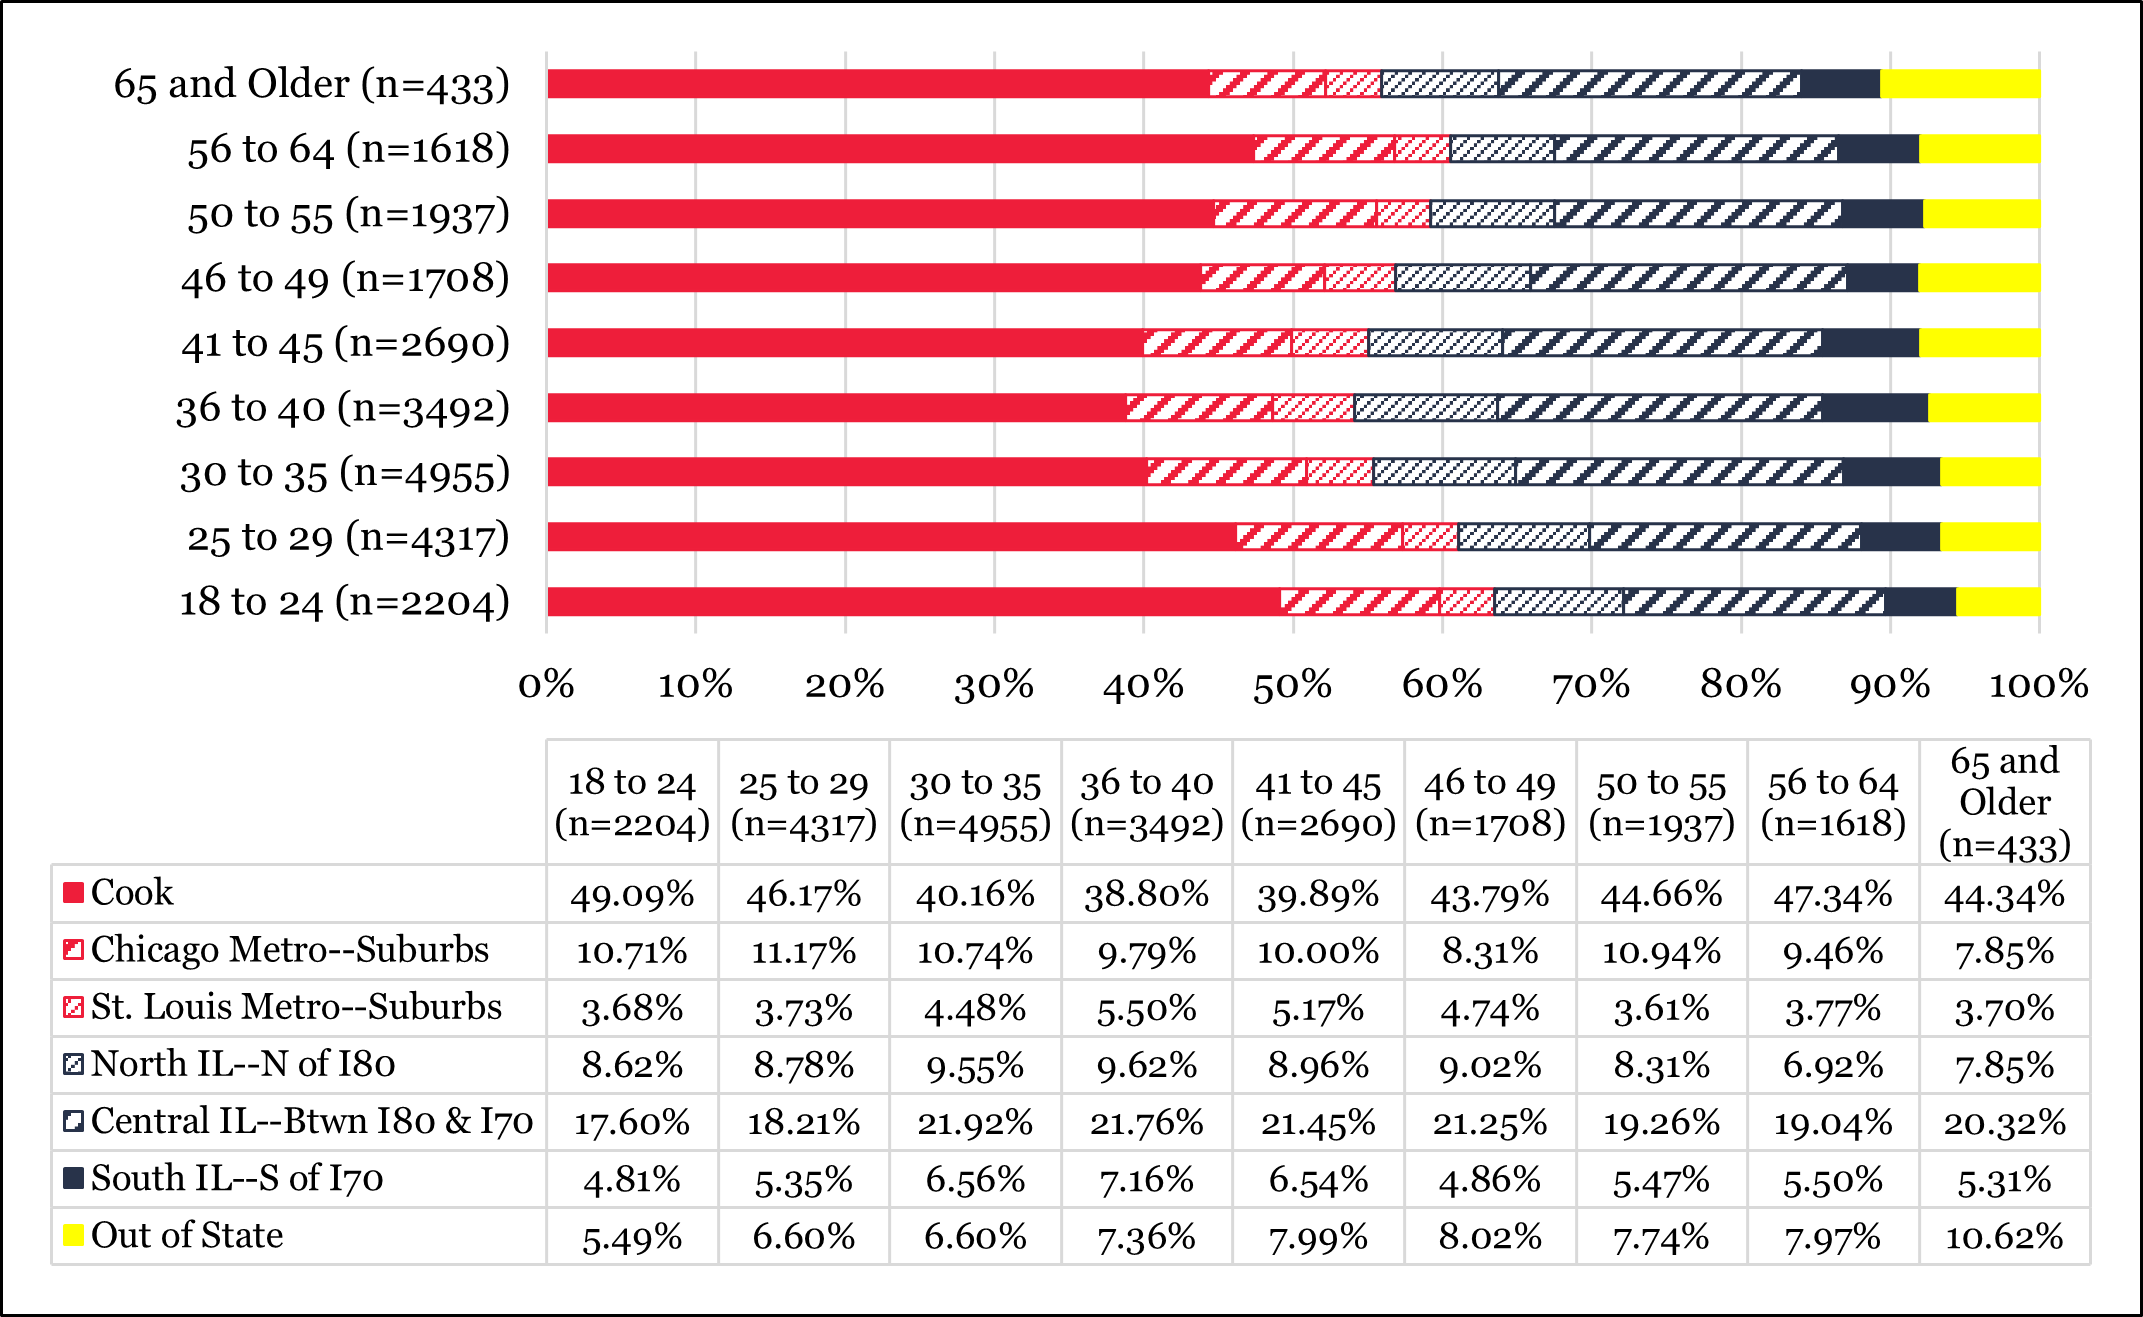
62. County Where Person on MSR Resides—Regional Parsed by Age (n = 23,354)

* County Where Person on MSR Resides—Regional (columns in table) total to 100%
63. County of Residence—Sentencing County Match Parsed by Age (n = 23,354)

* County of Residence—Sentencing County Match (columns in table) total to 100%
Section Six: Detailed Profile of People on MSR as of 12/31/20 by Race
There are more racial identity values in the IDOC Parole Population data set dated 12/31/20 than is represented by the JHA “Race” variable. We condensed the following racial identities into a single ‘Other’ category (n = 231), as the percentage of IDOC’s MSR population represented by each is close to zero percent: American Indian, Asian, Bi-Racial, and Unknown. When generating bivariate tables and graphs presented in this profile, JHA does not use the ‘Other’ category due to the small number of people counted as ‘Other’ and the values included in the ‘Other’ category are unrelated.
To compare the racial composition of categories listed in the bivariate tables below, the racial composition of IDOC’s MSR population with the ‘Other’ category excluded (n = 23,124) is as follows:
Race (n = 23,124)

Demographic Characteristics of People on MSR Parsed by Race (represented by colored sections within bars)
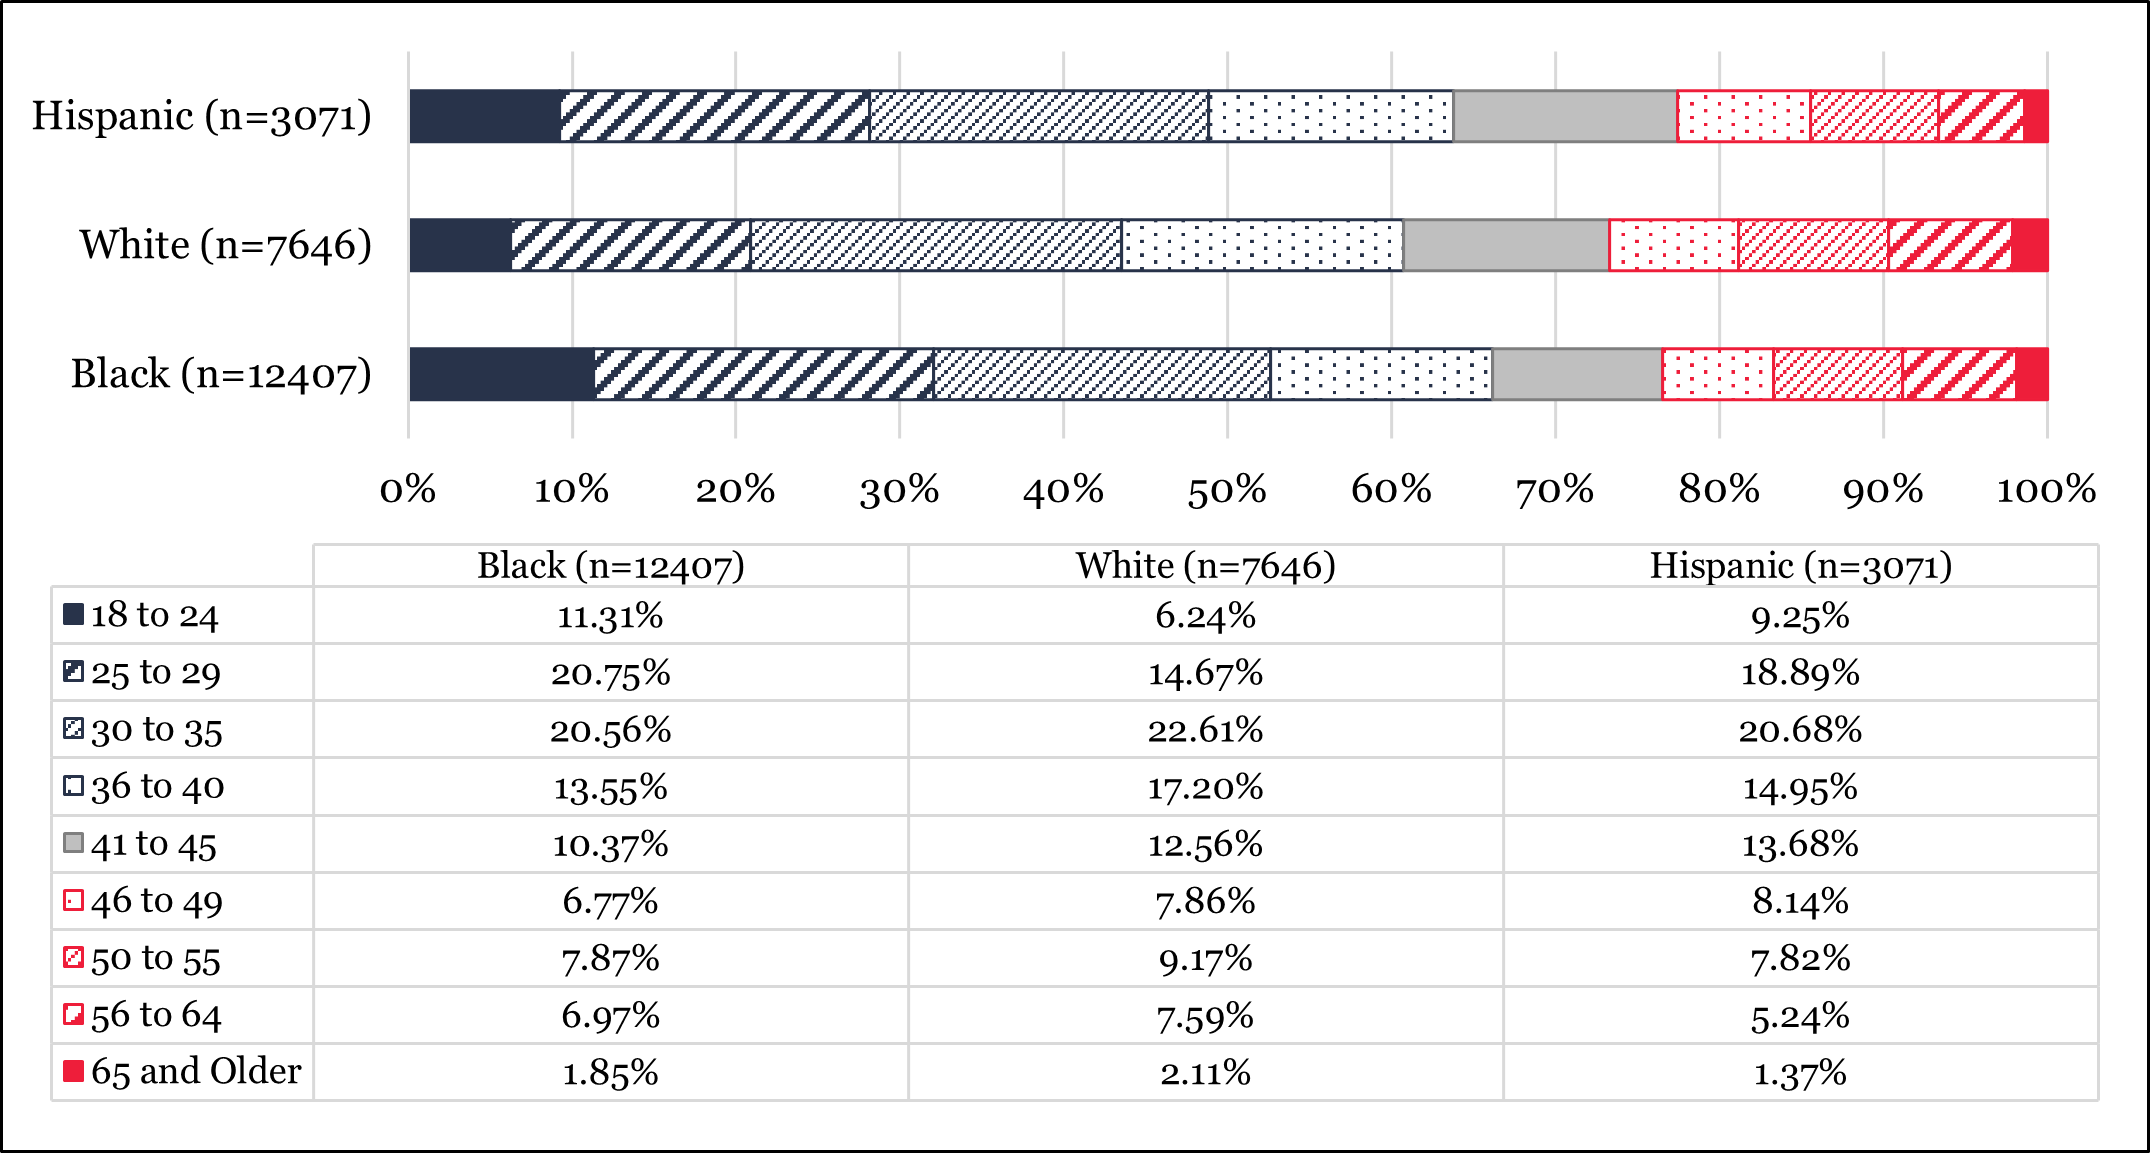
64. Age of People on MSR as of December 31, 2020* Parsed by Race (n= 23,124)

* Age of People on MSR as of December 31, 2020 (columns in table) total to 100%
65. Estimated Age at Custody* Parsed by Race (n = 23,124)

* Estimated Age at Custody (columns in table) total to 100%
66. Age at Release* [from prison] Parsed by Race (n = 23,116)

* Age at Release (columns in table) total to 100%
67. Gender* Parsed by Race (n = 29,111)

* Gender (columns in table) total to 100%
Legal Characteristics of People on MSR Parsed by Race (represented by colored sections within bars)
68. Admission Type—Recidivism* Parsed by Race (n = 23,124)

* Admission Type—Recidivism (columns in table) total to 100%
69. JHA Offense Type* Parsed by Race (n = 23,124)

* JHA Offense Type (columns in table) total to 100%
70. Felony Class of Holding Offense* Parsed by Race (n = 23,107)

* Felony Class of Holding Offense (columns in table) total to 100%
71. Length of Court-Imposed Prison Sentence for Holding Offense* Parsed by Race (n = 23,107)

* Length of Court-Imposed Prison Sentence for Holding Offense (columns in table) total to 100%
72. Estimated Length of Court-Imposed Prison Sentence for Holding Offense After “Truth in Sentencing” Multiplier Applied* Parsed by Race (n = 23,107)

* Estimated Length of Court-Imposed Prison Sentence for Holding Offense After “Truth in Sentencing” Multiplier Applied (columns in table) total to 100%
73. Length of Time Served in Prison/Jail for Holding Offense Prior to MSR* Parsed by Race (n = 23,124)

* Length of Time Served in Prison/Jail for Holding Offense Prior to MSR (columns in table) total to 100%
74. Subject to “Truth in Sentencing” for Holding Offense* Parsed by Race (n = 23,107)

* Subject to “Truth in Sentencing” for Holding Offense (columns in table) total to 100%
75. Estimated Time Until Discharge from MSR* Parsed by Race (n = 23,124)
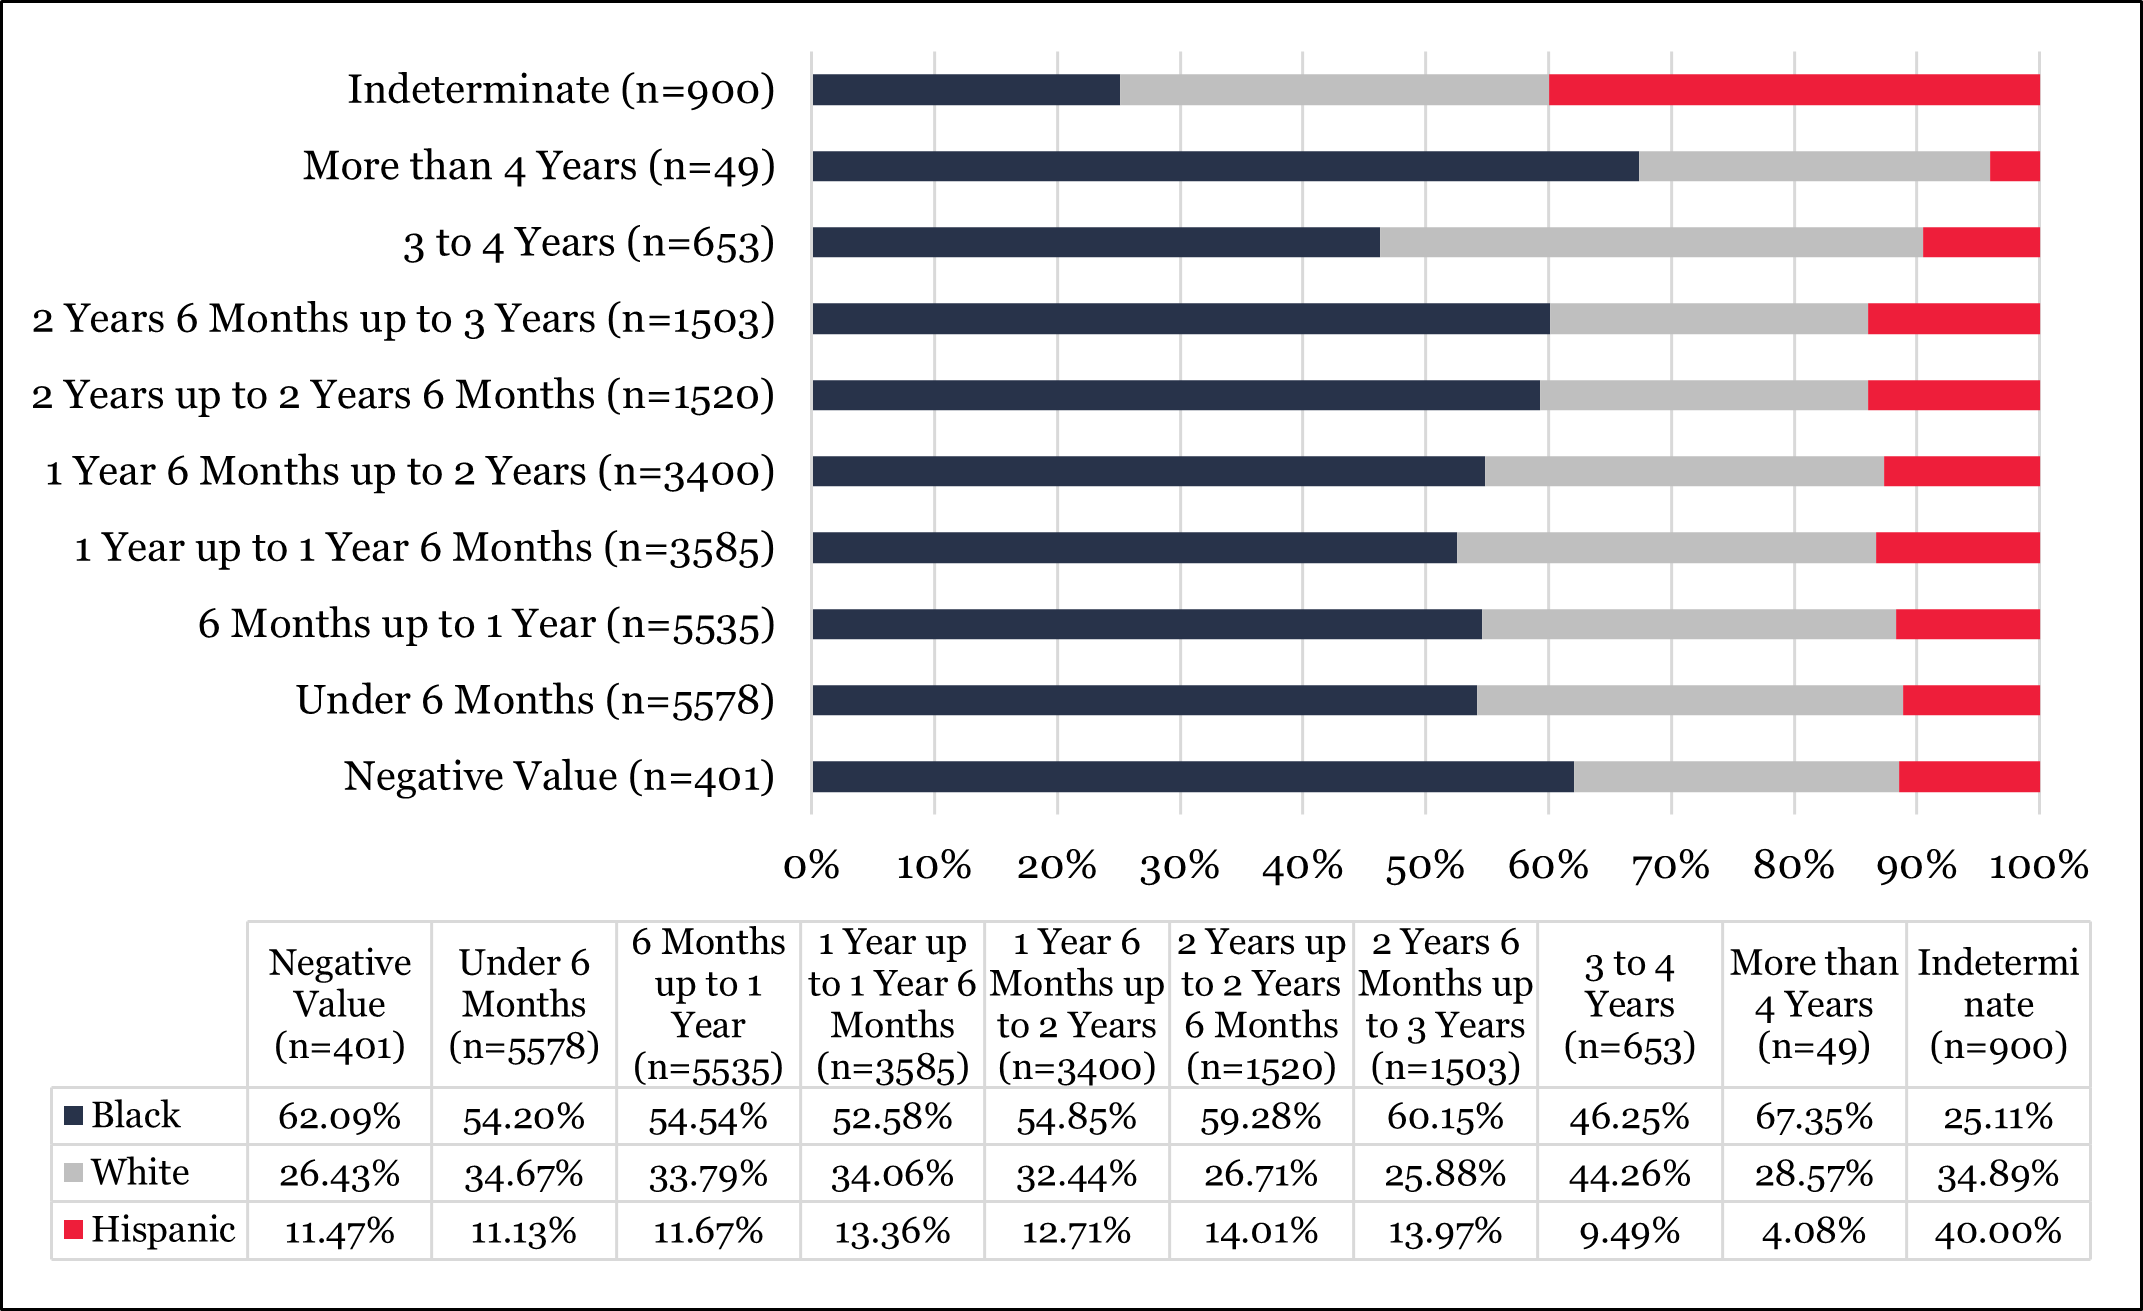
* Estimated Time Until Discharge from MSR (columns in table) total to 100%
76. County Where Person was Sentenced for Holding Offense—Regional* Parsed by Race (n = 23,124)

* County Where Person was Sentenced for Holding Offense—Regional (columns in table) total to 100%
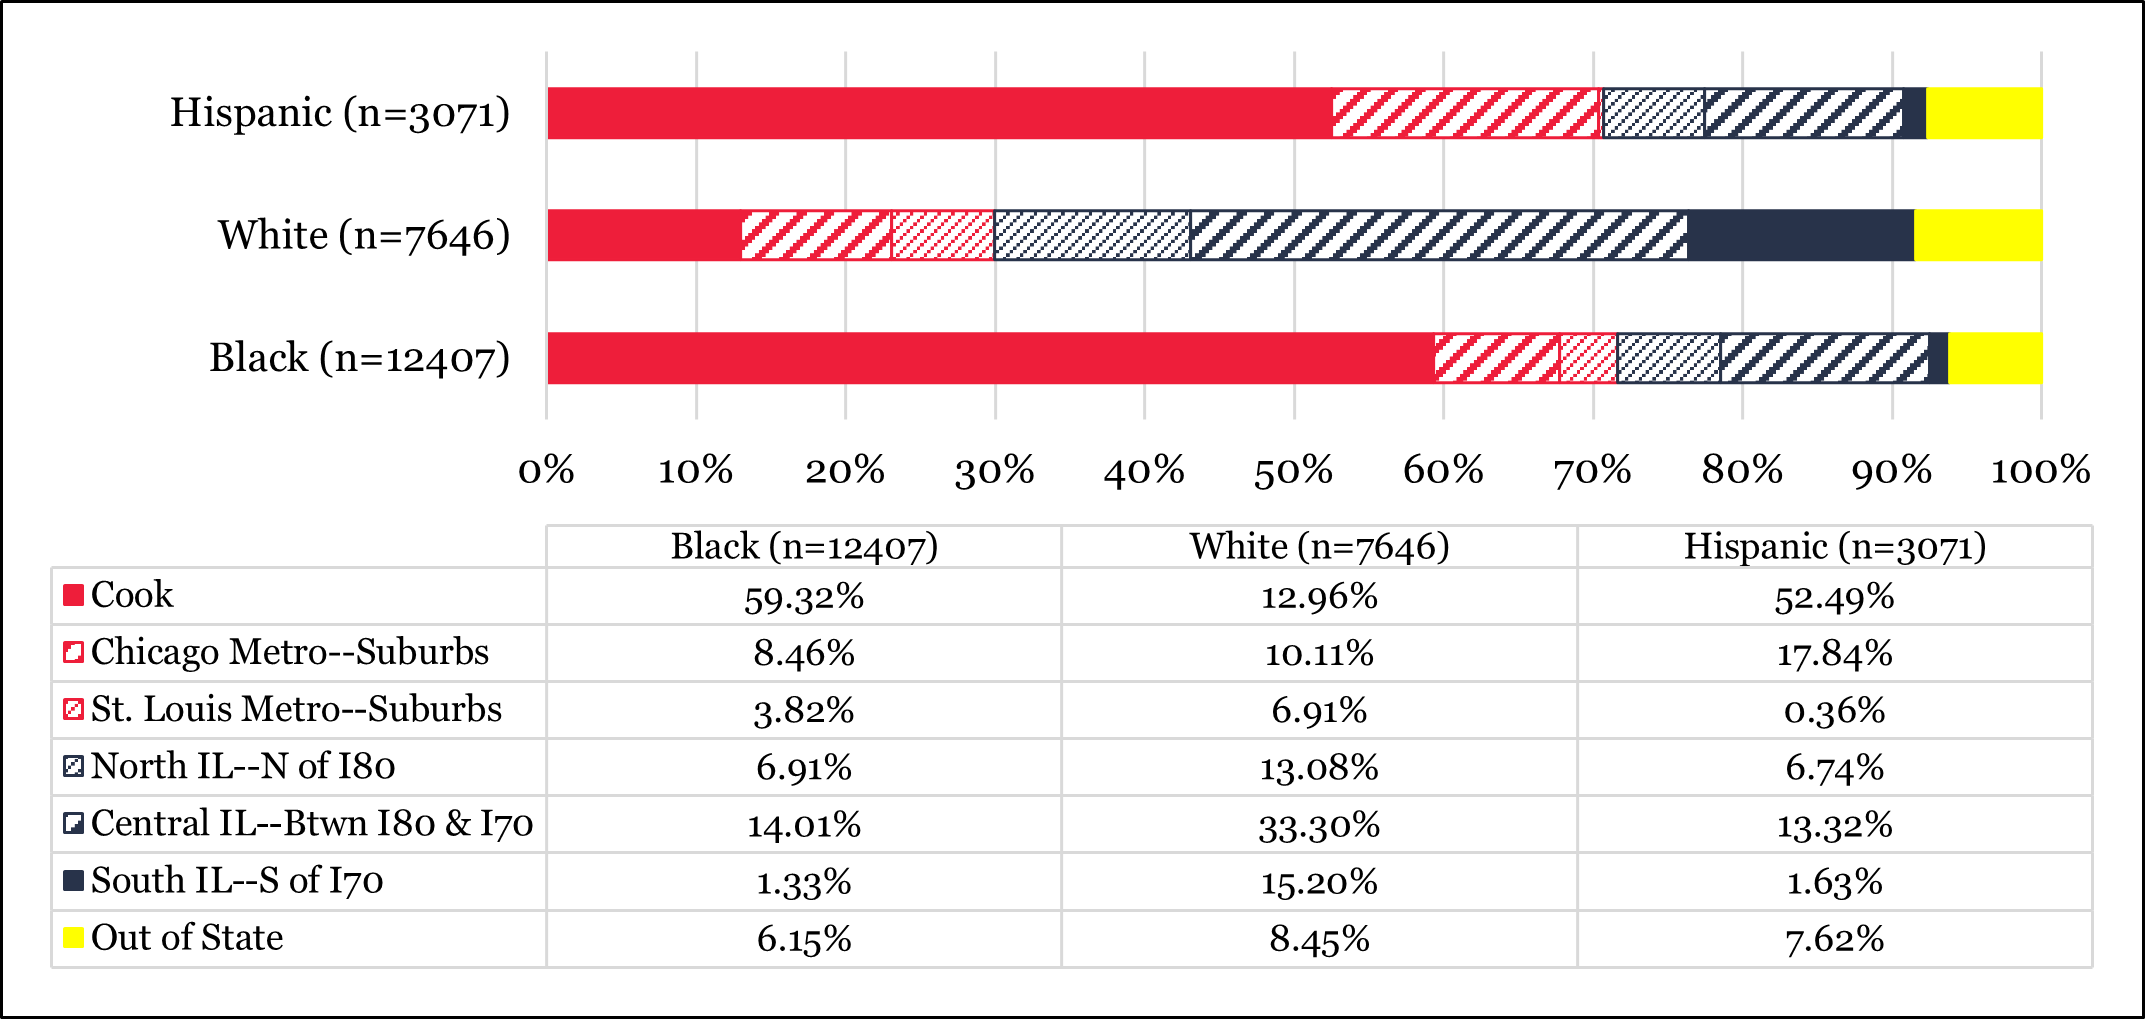
77. County Where Person on MSR Resides—Regional* Parsed by Race (n = 23,124)

* County Where Person on MSR Resides—Regional (columns in table) total to 100%
78. County of Residence—Sentencing County Match (n = 23,124)

* County of Residence—Sentencing County Match (columns in table) total to 100%
Section Seven: Detailed Profile of People on MSR as of 12/31/20 by JHA Offense Type
Offense Type indicates the nature of the criminal offense listed as a person’s holding offense that resulted in their court-imposed prison sentence which is followed by a mandatory term of post-carceral supervision (MSR) in the community. JHA and IDOC do not use a uniform definition for offense types, as IDOC possesses more information about people on MSR and the criminal offenses that resulted in their incarceration than is made available to the public in the IDOC population data sets. JHA classifies criminal offenses by offense type using the plain language of the statute describing each offense and court findings (example: court finding of great bodily harm). Find a description of each JHA Offense Type here.
The graph immediately following this paragraph illustrates the Offense Type of people’s holding offense, grouped into categories, for the entire population of people on MSR status under the supervision of IDOC in the community as of 12/31/20. The reference graph below is identical to graph 9 above, and is to be used as reference for comparisons between the size of these groups across the IDOC MSR population versus the size of these groups within the categories included in the graphs within this section.
JHA Offense Type of Holding Offense* (n = 23,355)

* Categories within the above graph were created by JHA using individual offenses as listed within the IDOC data set. A listing of individual offenses included within each JHA created offense type can be found here.
Demographic Characteristics of People on MSR Parsed by JHA Offense Type (represented by colored sections within bars)
79. Age of People on MSR as of December 31, 2020* Parsed by Offense Type (n = 23,354)

* Age of People on MSR as of December 31, 2020 (columns in table) total to 100%
80. Estimated Age at Custody* Parsed by Offense Type (n = 23,354)

* Estimated Age at Custody (columns in table) total to 100%
81. Age at Release* [from prison] Parsed by Offense Type (n = 23,346)

* Age at Release (columns in table) total to 100%
82. Gender* Parsed by Offense Type (n = 23,355)

* Gender (columns in table) total to 100%
83. Race* Parsed by Offense Type (n = 23,124)

* Race (columns in table) total to 100%
Legal Characteristics of People on MSR Parsed by JHA Offense Type (represented by colored sections within bars)
84. Admission Type—Recidivism* Parsed by Offense Type (n = 23,355)

* Admission Type—Recidivism (columns in table) total to 100%
85. Felony Class of Holding Offense* Parsed by Offense Type (n = 23,337)

* Felony Class of Holding Offense (columns in table) total to 100%
86. Length of Court-Imposed Prison Sentence for Holding Offense* Parsed by Offense Type (n = 23,317)

* Length of Court-Imposed Prison Sentence for Holding Offense (columns in table) total to 100%
87. Estimated Length of Court-Imposed Prison Sentence for Holding Offense After “Truth in Sentencing” Multiplier Applied* Parsed by Offense Type (n = 23,337)

* Estimated Length of Court-Imposed Prison Sentence for Holding Offense After “Truth in Sentencing” Multiplier Applied (columns in table) total to 100%
88. Length of Time Served in Prison/Jail for Holding Offense Prior to MSR* Parsed by Offense Type (n = 23,355)
* Length of Time Served in Prison/Jail for Holding Offense Prior to MSR (columns in table) total to 100%
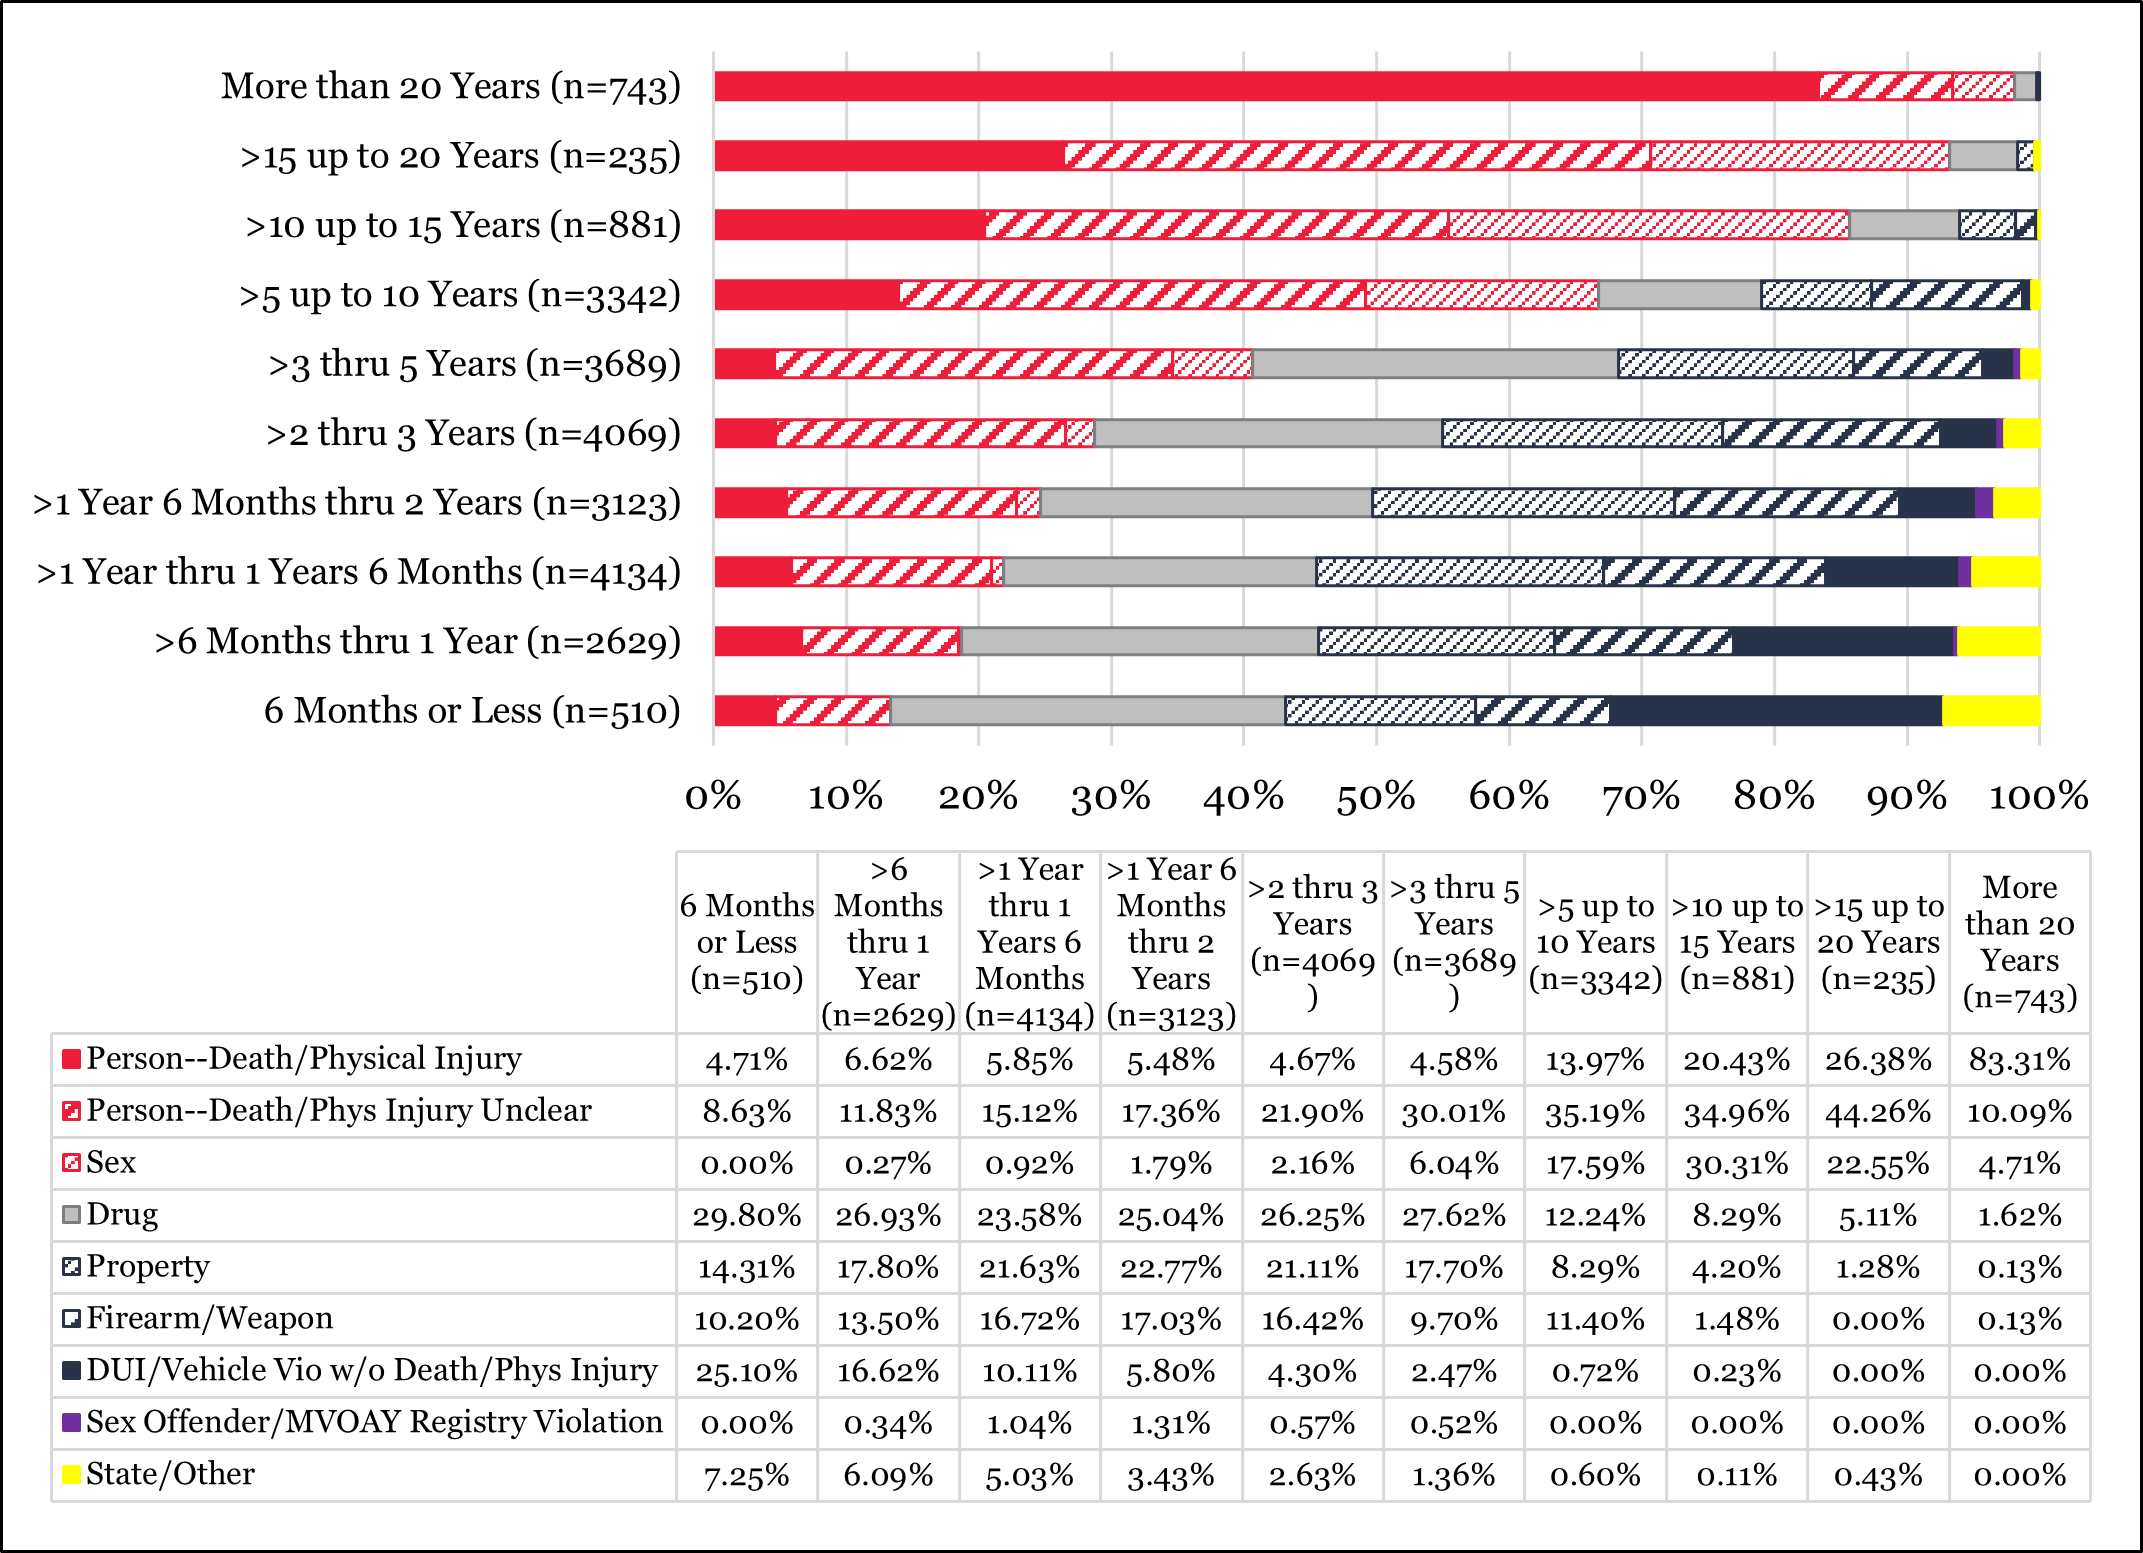
89. Subject to “Truth in Sentencing” for Holding Offense* Parsed by Offense Type (n = 23,337)

* Subject to “Truth in Sentencing” for Holding Offense (columns in table) total to 100%
90. Estimated Time Until Discharge from MSR* Parsed by Offense Type (n = 23,355)

* Estimated Time Until Discharge from MSR (columns in table) total to 100%
91. County Where Person on MSR was Sentenced for Holding Offense—Regional* Parsed by Offense Type (n = 23,355)

* County Where Person on MSR was Sentenced for Holding Offense—Regional (columns in table) total to 100%
92. County Where Person on MSR Resides—Regional* Parsed by Offense Type (n = 23,355)

* County Where Person on MSR Resides—Regional (columns in table) total to 100%
93. County of Residence—Sentencing County Match Parsed by Offense Type (n = 23,355)

* County of Residence—Sentencing County Match (columns in table) total to 100%
Section Eight: Detailed Profile of People on MSR as of 12/31/2020 by County Where Person on MSR Resides—Regional
County Where Person on MSR Resides—Regional reflects the region within Illinois where a person on MSR resided as of 12/31/2020.
The graph immediately following this paragraph illustrates the county where people on MSR reside, grouped into categories, for the entire population of people on MSR status under the supervision of IDOC. It is identical to graph 18, and is to be used as reference for comparisons between the size of these groups across the IDOC MSR population versus the size of these groups within the categories included in the graphs within this section.
County Where Person on MSR Resides—Regional (n = 23,355)

* A list of counties by region can be found here.
Demographic Characteristics of People on MSR Parsed by County Where Person on MSR Resides—Regional (represented by colored sections within bars)
94. Age of People on MSR as of 12/31/2020* Parsed by County Where Person on MSR Resides—Regional (n = 23,354)
* Age of People on MSR as of December 31, 2020 (columns in table) total to 100%
95. Estimated Age at Custody* Parsed by County Where Person on MSR Resides—Regional (n = 23,354)

* Estimated Age at Custody (columns in table) total to 100%
96. Age at Release* [from prison] Parsed by County Where Person on MSR Resides—Regional (n = 23,346)

* Age at Release (columns in table) total to 100%
97. Gender* Parsed by County Where Person on MSR Resides—Regional (n = 23,355)

* Gender (columns in table) total to 100%
98. Race Parsed by County Where Person on MSR Resides—Regional (n = 23,355)
* Race (columns in table) total to 100%
Legal Characteristics of People on MSR Parsed by County Where Person on MSR Resides—Regional (represented by colored sections within bars)
99. Admission Type—Recidivism* Parsed by County Where Person on MSR Resides—Regional (n = 23,355)

* Admission Type—Recidivism (columns in table) total to 100%
100. JHA Offense Type of Holding Offense* Parsed by County Where Person on MSR Resides—Regional (n = 23,355)

* JHA Offense Type of Holding Offense (columns in table) total to 100%
101. Felony Class of Holding Offense* Parsed by County Where Person on MSR Resides—Regional (n = 23,337)

* Felony Class of Holding Offense (columns in table) total to 100%
102. Length of Court-Imposed Prison Sentence for Holding Offense Parsed by County Where Person on MSR Resides—Regional (n = 23,337)

* Length of Court-Imposed Prison Sentence for Holding Offense (columns in table) total to 100%
103. Estimated Length of Court-Imposed Prison Sentence for Holding Offense After “Truth in Sentencing” Multiplier Applied* Parsed by County Where Person on MSR Resides—Regional (n = 23,337)
* Estimated Length of Court-Imposed Prison Sentence for Holding Offense After “Truth in Sentencing” Multiplier Applied (columns in table) total to 100%
104. Length of Time Served in Prison/Jail for Holding Offense Prior to MSR Parsed by County Where Person on MSR Resides—Regional (n = 23,355)

* Length of Time Served in Prison/Jail for Holding Offense Prior to MSR (columns in table) total to 100%
105. Subject to “Truth in Sentencing” for Holding Offense* Parsed by County Where Person on MSR Resides—Regional (n = 23,337)

* Subject to “Truth in Sentencing” for Holding Offense (columns in table) total to 100%
106. Estimated Time Until Discharge from MSR* Parsed by County Where Person on MSR Resides—Regional (n = 23,355)

* Estimated Time Until Discharge from MSR (columns in table) total to 100%
107. County Where Person was Sentenced for Holding Offense—Regional* Parsed by County Where Person on MSR Resides—Regional (n = 23,355)

* County Where Person was Sentenced for Holding Offense—Regional (columns in table) total to 100%
108. County of Residence—Sentencing County Match* Parsed by County Where Person on MSR Resides—Regional (n = 23,355)

* County of Residence—Sentencing County Match (columns in table) total to 100%
~subheadIndex-h3