IDOC Prison Population Profile
(as of December 31, 2020)
The following information is based upon IDOC’s Prison Population Data Set for 12/31/20 that is accessible to the public on the IDOC website.
JHA analyzed this data to create a profile of IDOC’s prison population to increase the public’s understanding about the people who are in prison. We also used the IDOC data set to generate charts and graphs representing nuanced breakdowns of information related to IDOC’s prison population and to make comparisons to the IDOC prison population over time.
The IDOC Population Data Set was processed by JHA staff using IBM’s SPSS statistics software. Most of the information in the data set was transformed into the variables presented herein. Terms and methodology can be found here. Detailed information (individual-level data) contained within some categories presented herein can be found here. Finally, there were several corrections made by JHA to the IDOC data set; a complete list of these changes can be found here.
(Want to view MSR/Parole Population data instead? Click here.)
Sections below include:
~subheadIndex-links
Section One: Summary of the Demographic Characteristics of the IDOC Prison Population
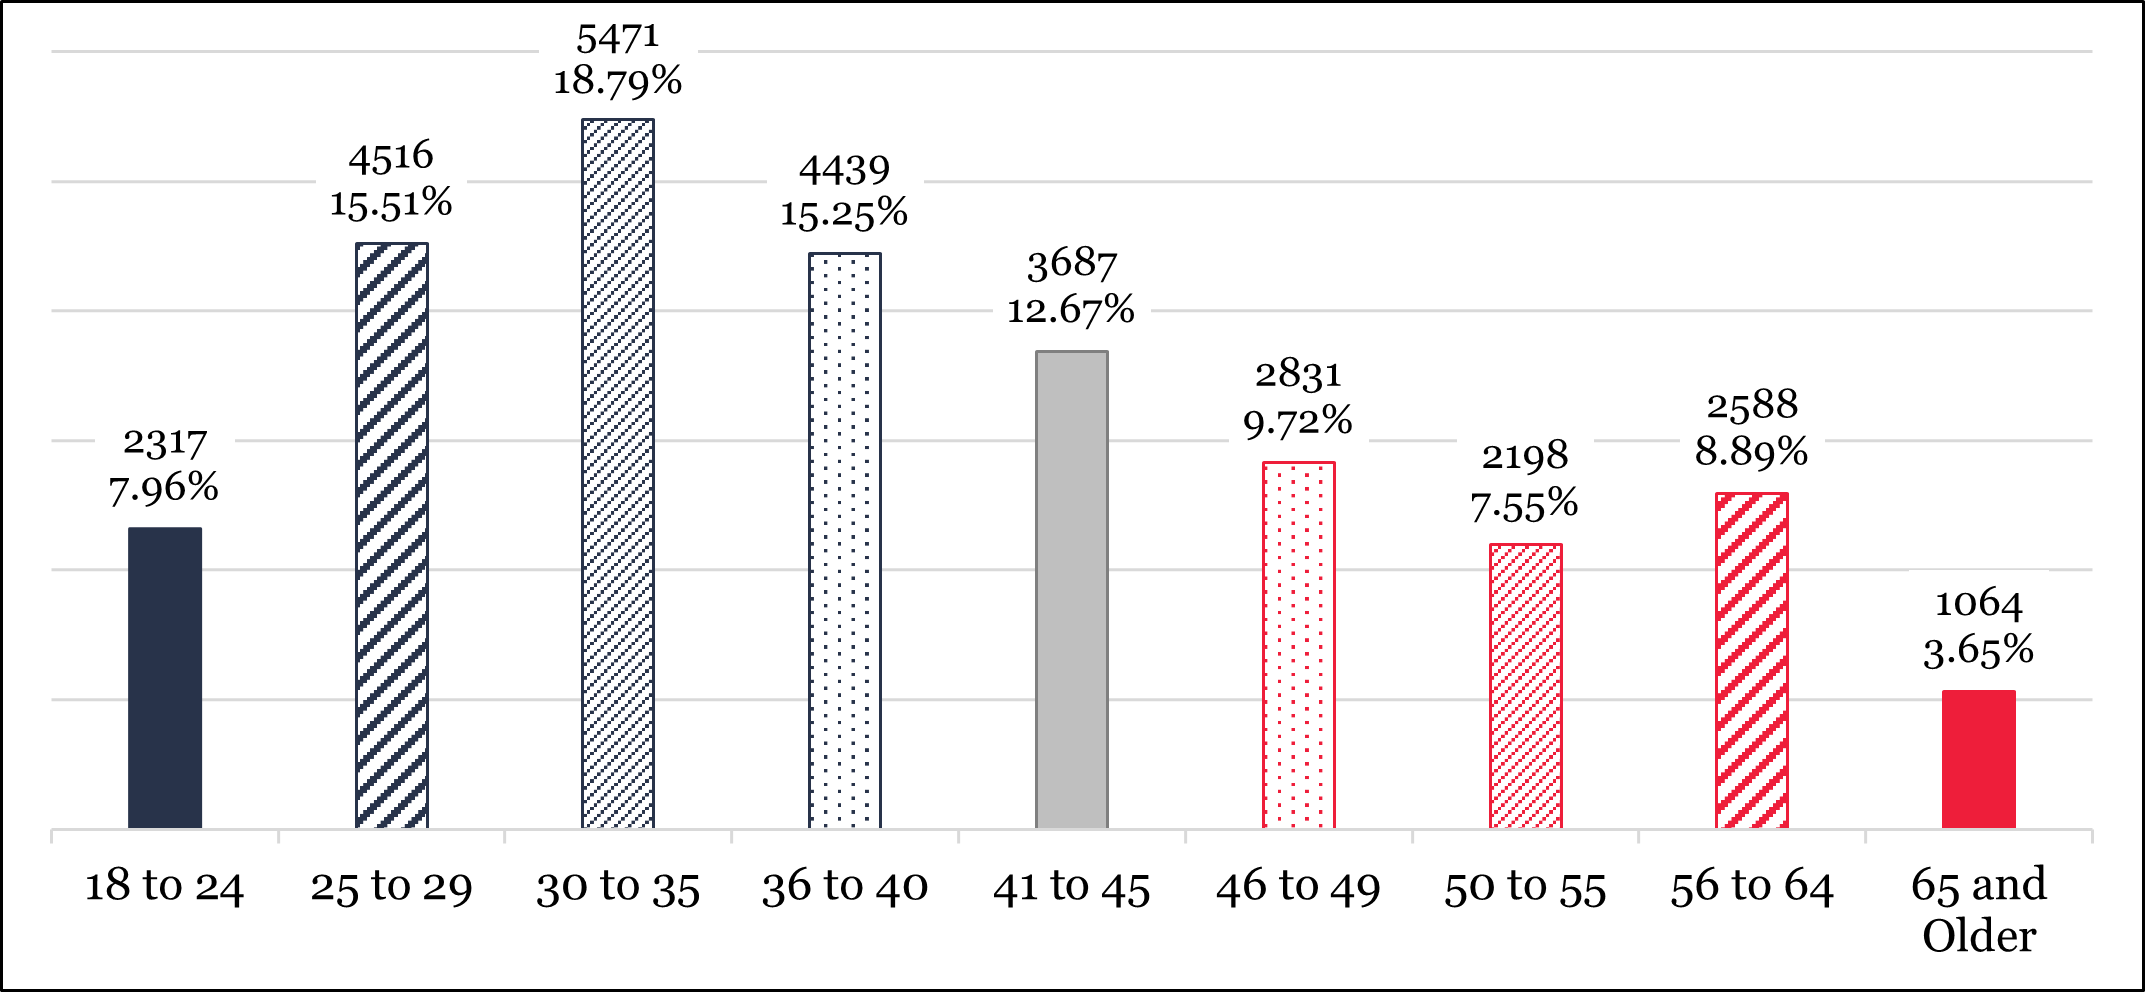
1. Age of Incarcerated People as of December 31, 2020 (n = 29,111)

The average age of a person incarcerated in IDOC as of 12/31/20 was 39.8 years old, and the age of incarcerated people ranged from 18 to 92 years old. Although the average age was 39.8, only 15.25% of incarcerated people were in the ‘36 to 40’ age bracket. Considering the distribution of age of incarcerated people as shown in the graph above, the average age of IDOC’s population does not accurately reflect this demographic indicator across the prison population. A significant portion of IDOC’s population were 35 or younger (42.26%), and the majority (55.54%) of these people were between their late teens (18+) and late 20’s (up to 29). Also, approximately two-fifths of IDOC’s population (42.48%) were 41 or older, and nearly half (47.29%) of these people were 50 or older.
2. Estimated Age at Custody* (n = 29,111)

* Estimated age at custody represents an incarcerated person’s age when they were likely taken into custody by law enforcement for their holding offense.
The estimated age of a person when they were taken into custody by IDOC for their holding offense (also likely age at time offense was committed) was 31.3 years old on average, and ranged from 13 to 83 years old. Considering the distribution of the estimated age of people at custody as shown in the graph above, the average in this instance does not accurately reflect the age at which most people were taken into custody by IDOC for their holding offense across the prison population. Of IDOC’s prison population, 52.04% were 29 or younger when taken into custody for their holding offense, and most (65.33%) of these people were under the age of 24. Only 17.16% of incarcerated people were in the ‘30 to 35’ age bracket in which the estimated age at custody average is included. When the “Estimated Age at Custody” variable is reported as age brackets rather than an average, it is clear that the majority of these people were relatively young when they were taken into custody for their holding offense. Also, nearly one-third (30.81%) of incarcerated people were 36 or older when they were taken into custody for their holding offense.
3. Estimated Age at Release* (n = 29,111)

* Estimated age at release represents how old a person should be when released from prison; the ‘Unknown’ category includes (1) incarcerated people who do not have a Projected MSR or Discharge date listed by IDOC and (2) SDP (incarcerated people who are civilly committed to the custody of IDOC as Sexually Dangerous Persons, who do not have determinate release dates).
The average estimated age of an incarcerated person upon release is 46.1 years old if the range of estimated age at release is limited to 18 to 99 years of age (n = 26,534). Considering the distribution of the estimated age of incarcerated people upon release as shown in the graph above, the average in this instance does not accurately reflect the age most people will be upon release across the prison population. Of IDOC’s prison population, 35.40% will be 50 or older upon release, and 44.27% of these people are projected to be 65 or older upon release. Only 7.05% of people were in the ‘46 to 49’ age bracket in which the estimated age at release average is included. Over half (50.77%) of people incarcerated in IDOC will be 45 or younger upon release, and 28.34% of these people will be 29 or younger.
Of the 2,577 incarcerated people whose estimated age at release does not fall into the range of 18 to 99, 1,968 (76.37%) will either spend the remainder of their life in prison (n = 1,539) or their age at release could not be calculated because they have no projected MSR or Discharge date (n = 429). The remaining 609 (23.63%) of these people are projected to be between 100 and 1,453 years of age upon release.
4. Gender (n = 29,111)

5. Race* (n = 29,111)

* In this instance, the following IDOC racial categories were condensed into ‘Other’: American Indian, Asian, Bi-Racial, and Unknown.
Section Two: Summary of Legal Characteristics of the IDOC Prison Population
6. IDOC Admission Types* (n = 29,111)

* The IDOC Admission Types reflect what is reported in the IDOC data set.
7. Admission Type—Recidivism* (n = 29,111)

8. JHA Offense Type of Holding Offense* (n = 29,111)

* Categories within the above graph were created by JHA using individual offenses as listed within the IDOC data set. The definition of each JHA offense type category can be found here. A listing of individual offenses included within each JHA created offense type can be found here.
The graph above demonstrates that over half (53.26%) of people incarcerated in IDOC have a ‘Person’ offense listed as their holding offense by IDOC. Of the 8,997 people whose holding offense was classified by JHA to be a person offense that resulted in death or physical injury, most (70.94%) are imprisoned for murder. People whose holding offense was classified by JHA as a ‘Drug’ or ‘Property’ offense combine to make up 18.68%. These offense types are considered by most criminal justice practitioners to be less serious than ‘Person’ or ‘Sex’ offenses.
9. Felony Class of Holding Offense* (n = 28,951)

* Unclassified incarcerated people are not included in the graph above — SDPs (n = 158) and 2 people who are imprisoned for criminal contempt.
Over half (58.14%) of people’s holding offenses are either Class M (murder) or Class X. All offenses included in the Class M and Class X felony classes are non-probationable and are subject to a harsher sentencing range relative to most Class 1 through 4 offenses. Additionally, most offenses subject to 100% or 85% Truth in Sentencing are Class M and X respectively.
10. Length of Court-Imposed Prison Sentence for Holding Offense* (n = 28,953)

* SDPs (n = 158) are not included in the graph above.
The average length of the court-imposed sentence being served by an incarcerated person is 17.9 years, and the median length of court-imposed sentence is 11 years if the range of court-imposed sentences is limited to 1 through 100 years (n = 27,363). As court-imposed sentences within the 1-100 year range is not normally distributed (skewness: 1.74; kurtosis: 2.99), the proper measure of central tendency to use in this instance is the median of 11 years. As was true with the variables associated with age of incarcerated people, the graph above demonstrates that the median sentence length does not provide an accurate description of the court-imposed prison sentences being served across IDOC’s prison population. The median (and average) court-imposed sentence length falls within the ‘>10 thru 20’ bracket, which includes 20.65% of people. While one-fifth is a sizable proportion of IDOC’s population, most of the remaining four-fifths of people are serving much shorter or longer court-imposed sentences than those included in the ‘>10 thru 20’ bracket in which the median length of court-imposed sentence falls.
Nearly one-third (32.86%) of incarcerated people are serving a court-imposed sentence longer than 20 years (this includes the 1,539 people who will be imprisoned for the rest of their life). Close to half (46.48%) are serving a court-imposed sentence of 10 years of less. Many (44.79%) of the 13,459 people serving a court-imposed sentence of 10 years or less are serving a court-imposed sentence of 5 years or less. The overwhelming majority (99.85%) of the 6,028 people serving a court-imposed sentence of 5 years or less are imprisoned for a Class 1 through 4 felony offenses, most of which are probationable (i.e. a prison sentence is not mandatory).
11. Estimated Length of Court-Imposed Prison Sentence for Holding Offense
After “Truth in Sentencing” Multiplier Applied* (n = 28,953)

* The “Truth in Sentencing” multiplier is determined by law based on the holding offense (730 ILCS 5/3-6-3). A person may be required to serve 100%, 85%, 75%, or 50% of their court-imposed prison sentence. Thus, the multipliers are 1, .85, .75, and .5 respectively. A person whose sentence is calculated at 75% or 50% may earn sentencing credits that may reduce the time they are imprisoned for their holding offense. Conversely, a person whose sentence is calculated at 85%, 75%, or 50% may be required to serve up to 100% of their court-imposed sentence if they have “good time” revoked for violating IDOC rules. Please note that most incarcerated people are simultaneously serving multiple court-imposed prison sentences, concurrently or consecutively, and this may affect the “Truth in Sentencing” multiplier. SDPs (n = 158) are not included in the graph above.
The average length of court-imposed sentence after the “Truth in Sentencing” (TIS) multiplier is applied is 13.8 years and the median length is 7.5 years if the range of court-imposed sentences after the TIS multiplier is applied is limited to 6 months through 100 years (n = 27,391). Thus, after the TIS multiplier is applied to JHA’s “Length of Court-Imposed Prison Sentence for Holding Offense” variable, the average length of sentence decreases by 22.91% and the median length of sentence decreases by 31.82% for IDOC’s prison population overall. As court-imposed sentences after the TIS multiplier is applied within the 6 month through 100 year range is not normally distributed (skewness: 1.88; kurtosis: 3.8), the proper measure of central tendency to use in this instance is the median of 7.5 years.
The difference in the proportion of incarcerated people in the brackets represented in graph 10 compared to graph 11 is likely explained by the existence of a correlation between TIS and length of court-imposed sentence. People who are subjected to a court-imposed sentence of 10 years or less are more likely to have their sentence calculated by IDOC at “day-for-day” (i.e. 50%) by operation of law upon admission to IDOC, while people who are serving harsher court-imposed sentences (longer than 10 years) are more likely to have their sentence calculated by IDOC at 85% or 100% by operation of law upon admission to IDOC.
Comparing the graphic above to the graph representing length of court-imposed sentence alone (Graph 10), there is a substantial increase of the proportion of people who fall into the ‘2 years or less’ and ‘>2 to 5 year’ brackets after TIS was factored into length of court-imposed sentences (14.67% versus 3.48% for ‘2 Years or less,’ and 21.24% versus 17.33% for ‘>2 to 5 Years’). Conversely, the proportion of people included in the ‘>5 to 10 Years’ bracket dropped from 25.67% to 19.31% after the TIS multiplier was applied to the court-imposed sentence variable. For people included in brackets representing court-imposed sentences longer than 10 years, there was little change after the TIS multiplier was applied.
12. Subject to “Truth in Sentencing” for Holding Offense* (n = 28,953)

* Incarcerated people who are SDPs (n = 158) are not included because they do not have projected MSR dates. A person held by IDOC as a technical MSR violator should have their violation time calculated at the same Truth in Sentencing (TIS) rate as the custodial part of their prison sentence.
** People subject to 50% (i.e. day-for-day) or 75% TIS may earn sentencing credits reducing the amount of time they are imprisoned. Also, these people may serve more than 50% or 75% of their sentences respectively as the result of being sanctioned for a serious IDOC rule violation and other factors.
*** People required to serve 85%, 100%, or Life are prohibited by law from earning sentence credits that will result in a reduction of their court-imposed sentence. People required to serve 85% of their sentence may serve more than 85% as the result of being sanctioned for a serious IDOC rule violation and other factors. People under 100% TIS and people serving a life sentence cannot have their sentence extended because they have no “good time” that can be revoked.
Nearly half (49.46%) of the people incarcerated in IDOC are required to serve 85% or 100% of their court-imposed sentence. JHA counts those sentenced to life in prison amongst those who are under 100% Truth in Sentencing in this instance because a person sentenced to life will serve 100% of their sentence. As a prison sentence subject to 85% or 100% TIS correlates with harsh sentences of 10 years or more, it is likely the proportion of people over the age of 50 will steadily increase over time.
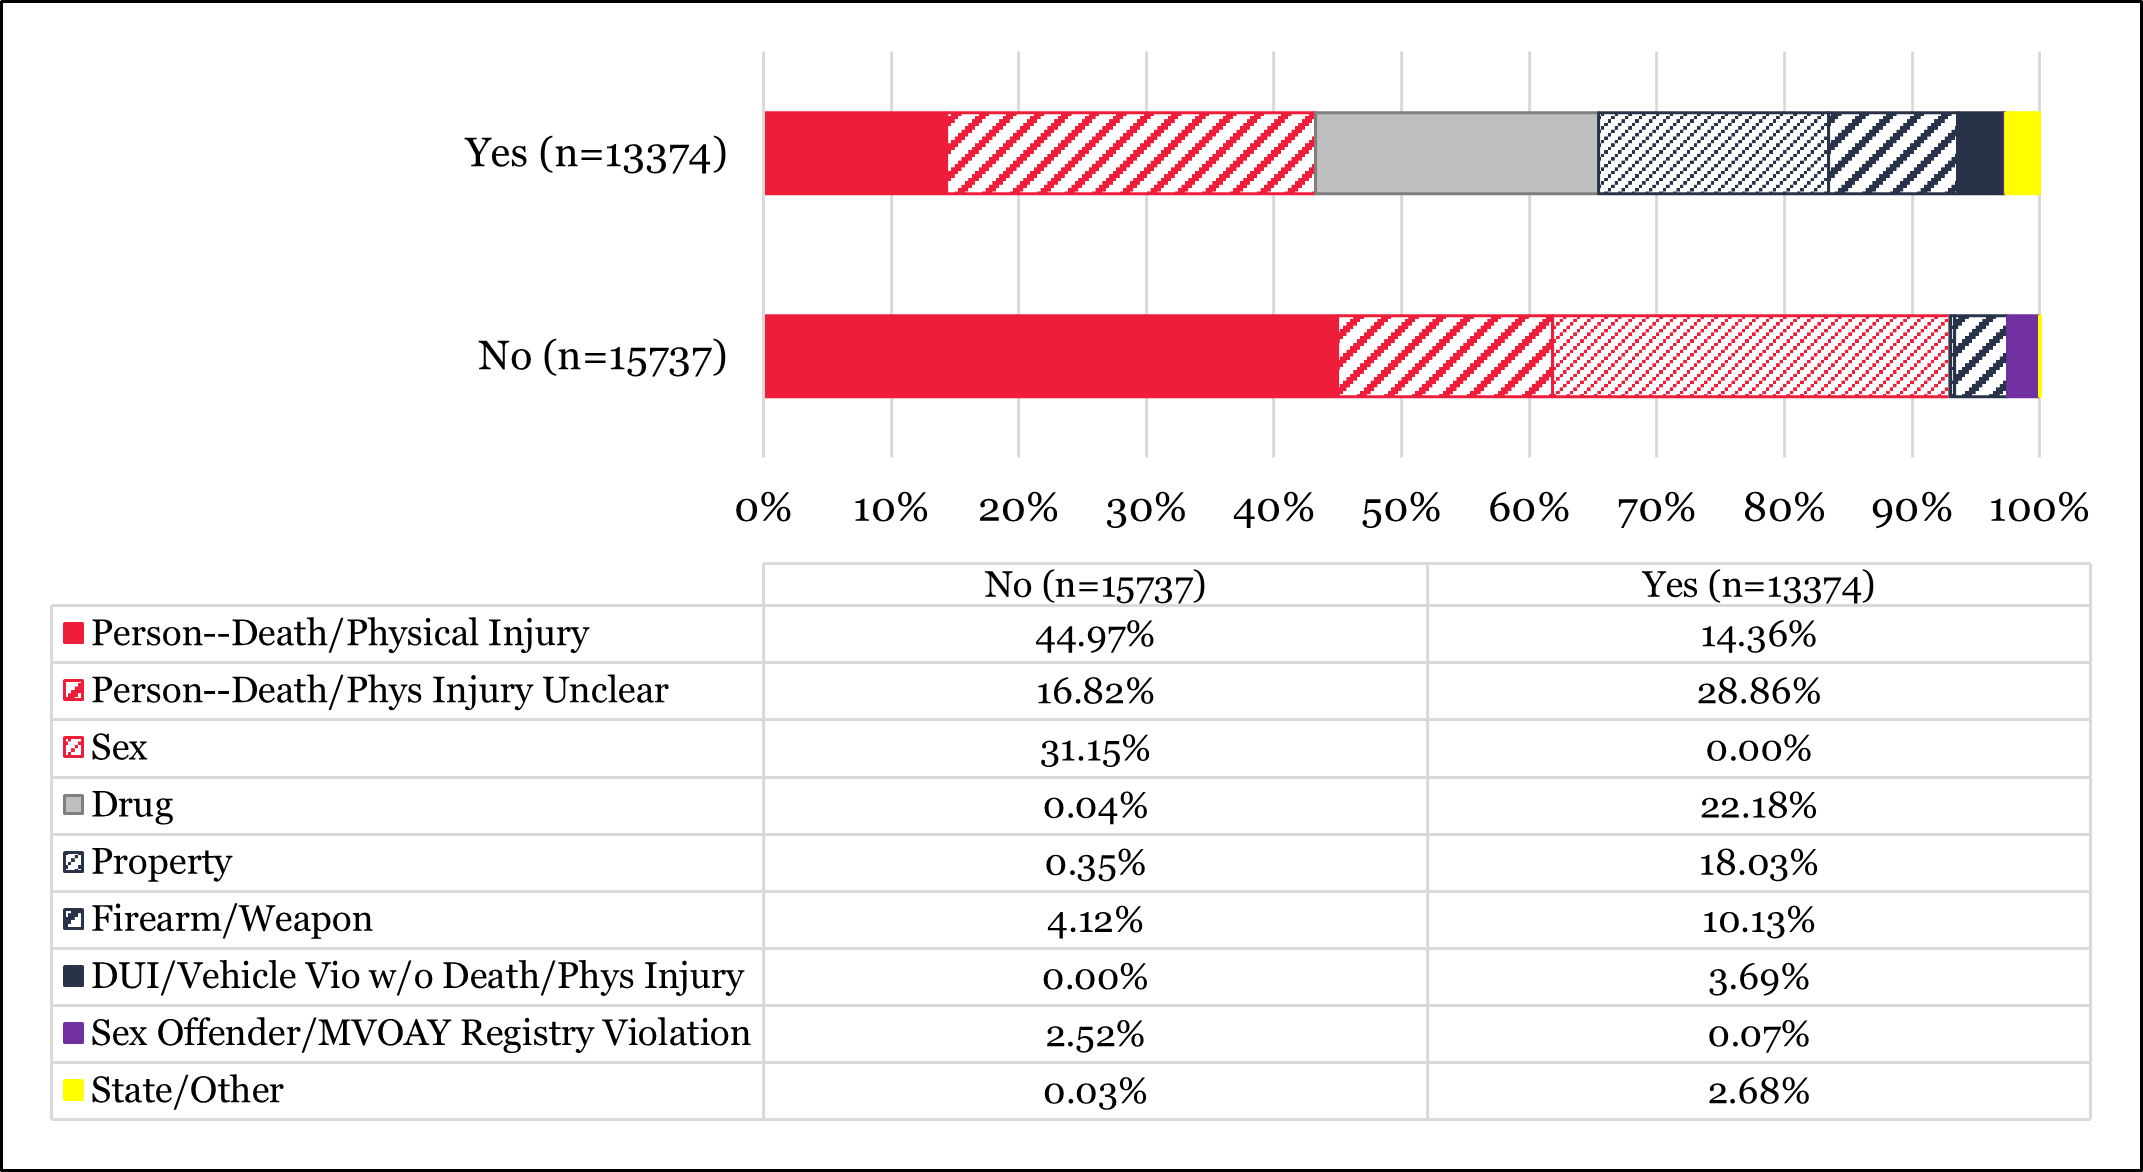
13. Effectively Eligible by Law to Receive Earned Sentence Credits for Holding Offense*
(n = 29,111)

* Incarcerated people in the “no” category include the following: people required to serve 100% or 85% of their court-imposed sentence under “Truth in Sentencing,” people serving a life sentence; people civilly committed to IDOC as SDPs; and anyone whose holding offense is a sex offense who is not included in a previously listed cohort. JHA determines who is statutorily eligible to receive earned sentence credits according to the plain language of the law governing sentencing credits (730 ILCS 5/3-6-3). IDOC may lawfully create eligibility criteria based on numerous factors that further restricts who may earn sentence credits.
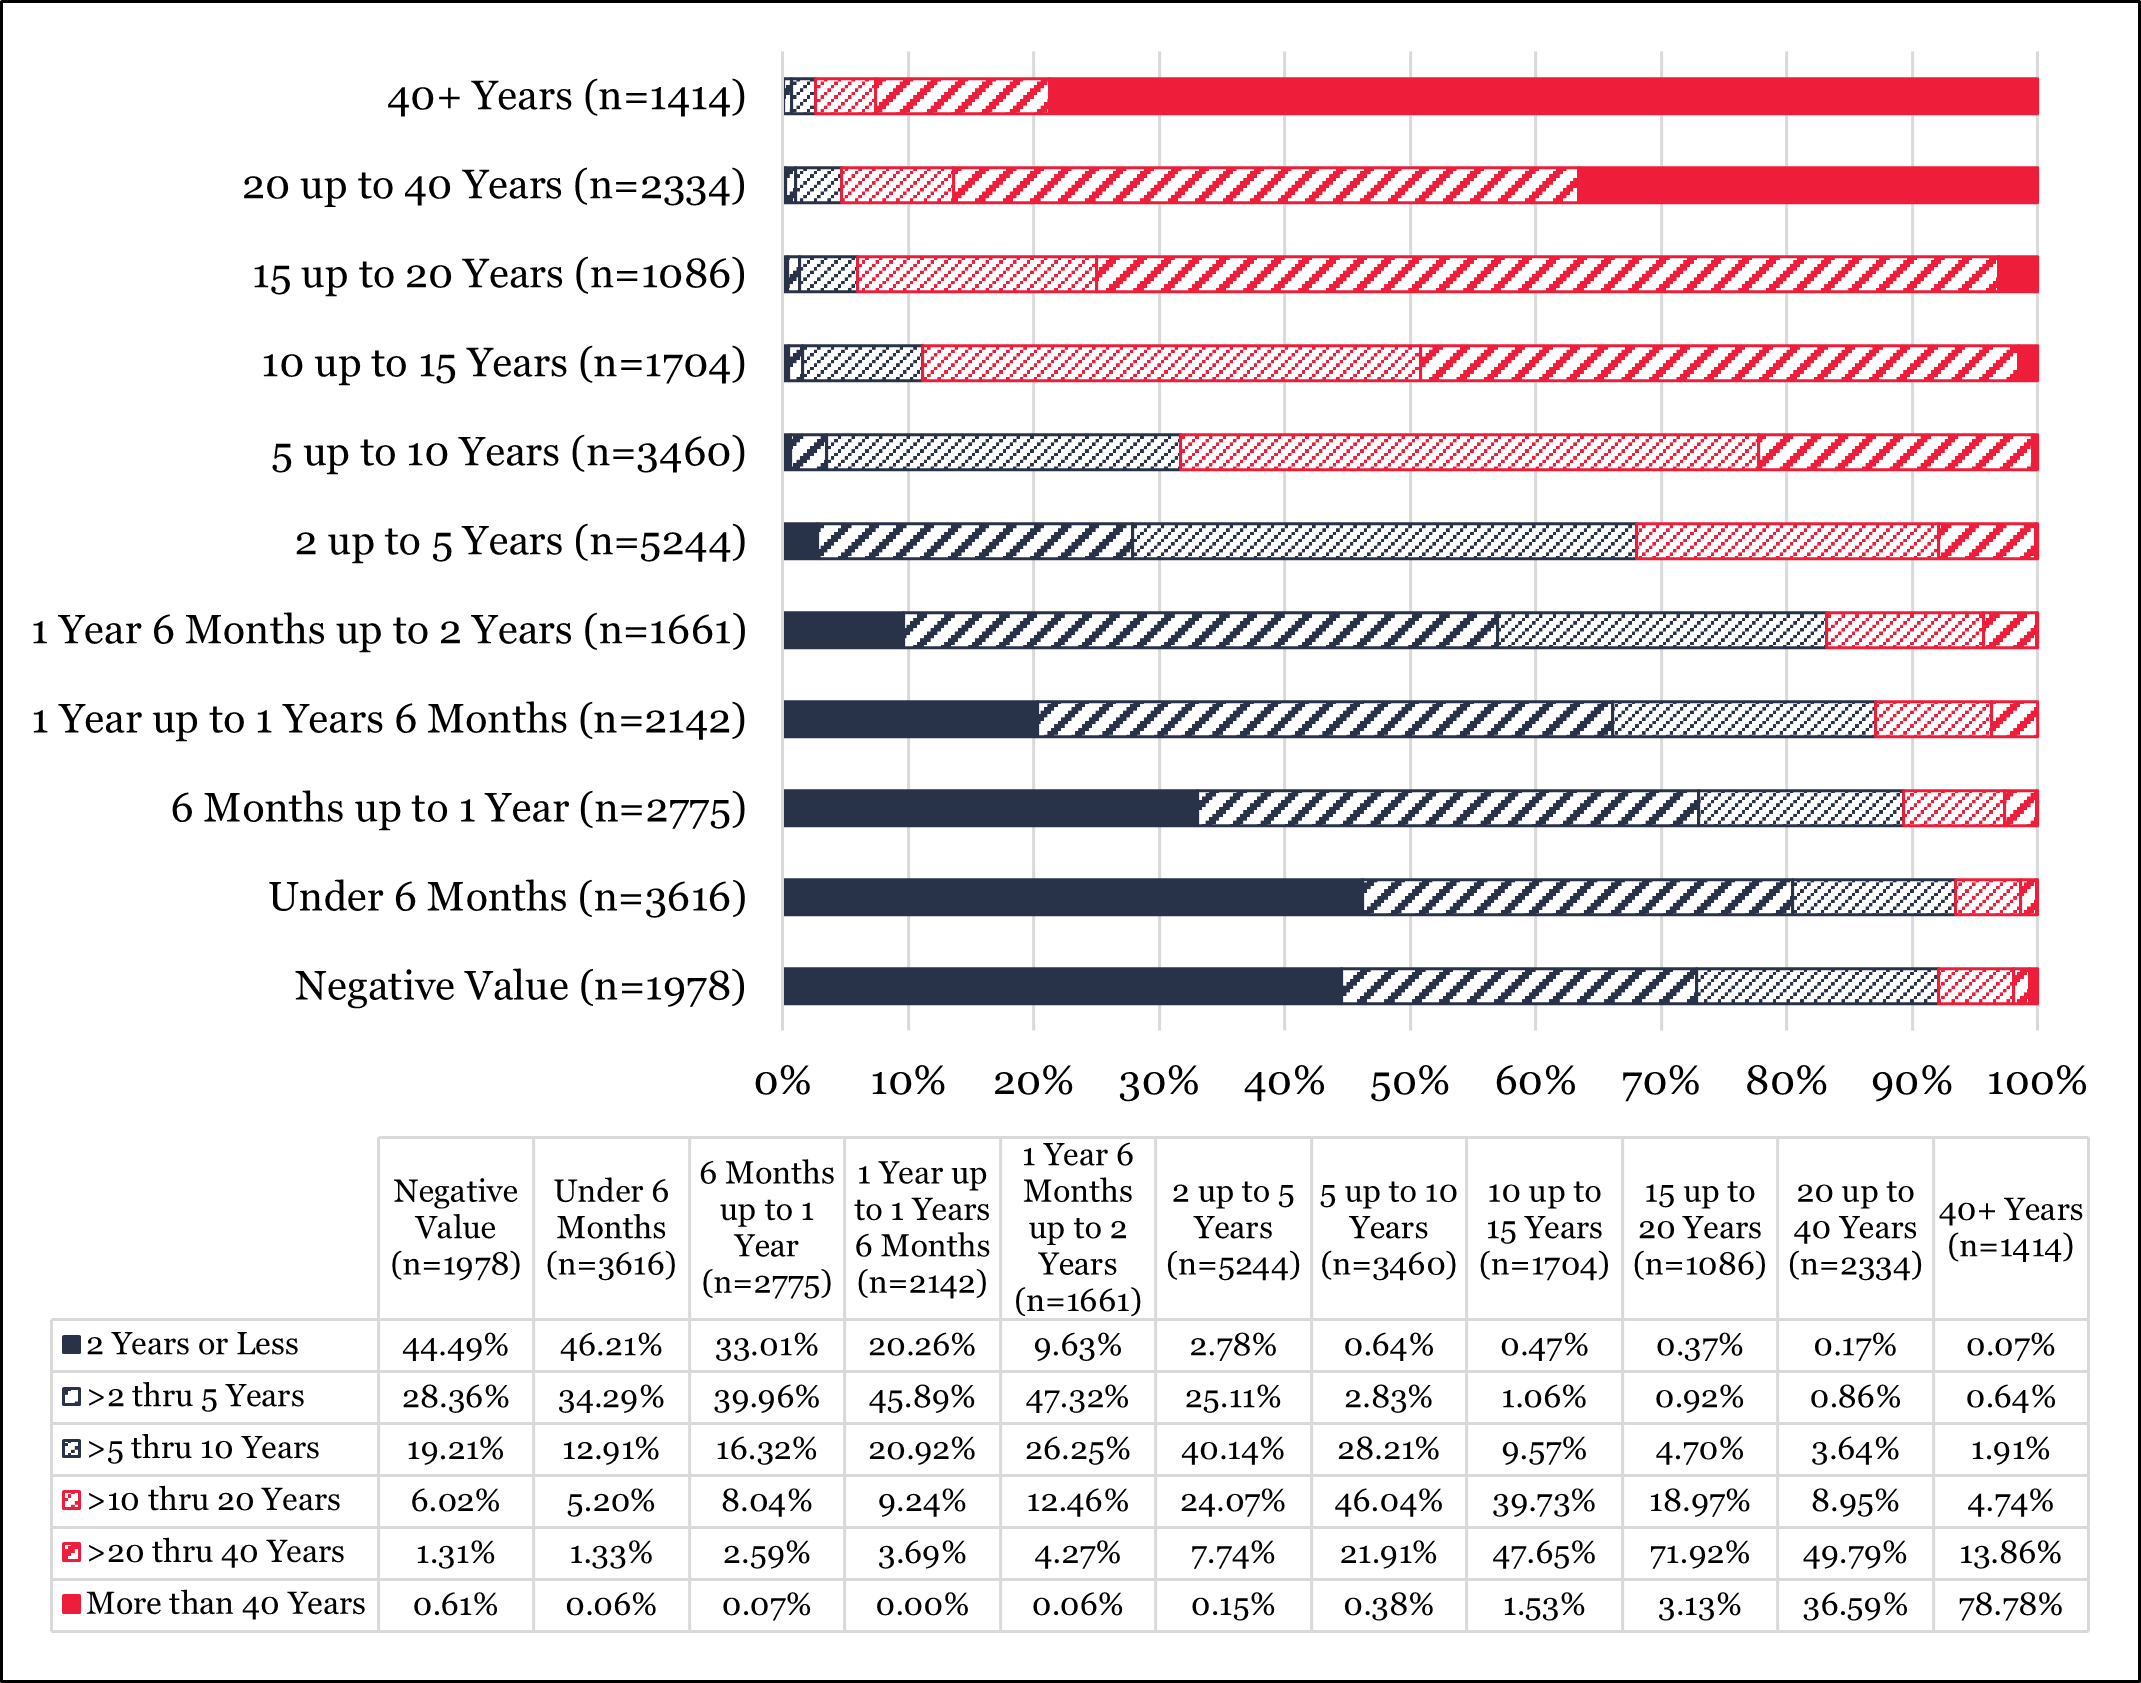
14. Estimated Time Until Release (based on Projected MSR date)* (n = 28,953)

* Incarcerated people included in the Negative Value category are mostly MSR or Parole violators who are being held past their Projected MSR Date. People who are SDPs (n = 158) are not included because they do not have projected MSR dates. The amount of time until release for most incarcerated people included in the graph above may change if “good time” is either awarded or revoked from them, and other factors.
Of the people who meet the condition of not being held in prison beyond their projected mandatory supervised release (MSR) date (negative values in the graph above), not serving a life sentence, and not an SDP (n = 25,377), the average number of months until their projected MSR date is 109.5 (appx. 9 years) and the median number of months until their projected MSR date is 36.7 months (appx. 3 years) IF the range of months until projected MSR date is limited to 0 through 1199.84 (appx. 100 years). As the months until projected MSR date within the 0 through 1,200 range is not normally distributed (skewness: 2.59; kurtosis: 7.51), the proper measure of central tendency to use in this instance is the median of 36.7 months.
Of the 25,377 people incarcerated who are within 0 to 1,200 months (100 years) of their projected MSR date, 6,479 (25.53%) of these people will remain imprisoned for another 120 months (10 years) or longer until their projected MSR date occurs. 10,194 of these people (40.17%) are within 24 months (2 years) of their projected MSR date.
15. County Where a Person was Sentenced for Holding Offense—Regional* (n = 29,110)

* A listing of counties included in each region can be found here. One person whose sentencing county was listed as ‘out of state’ by IDOC is not included in the graph above.
Section Three: Detailed Profile of the Prison Population by Age as of 12/31/20
Age represents the age of incarcerated people on the day the IDOC data set was generated. The graph immediately following this paragraph illustrates the age of people, grouped into categories, for the entire IDOC population as of 12/31/20. It is identical to graph 1 above and is to be used as reference for comparisons between the size of these groups across the IDOC prison population versus the size of these groups within the categories included in the graphs within this section.
Age of Incarcerated People as of December 31, 2020 (n = 29,111)
16. Estimated Age at Custody* Parsed by Age (n = 29,111)

* Estimated Age at Custody (columns in table) total to 100%
The graph above illustrates that over half (54.69%) of people who committed their holding offense between the age of 18 and 24 are now 29 or younger. Many people (45.30%) who committed their holding offense between 18 and 24 are now 30 or older, and over one-third (36.78%) of these are now over the age of 40. Relatively few people (1.64%) who committed their holding offense between the age of 18 and 24 are currently 50 or older.
17. Estimated Age at Release* Parsed by Age (n= 28,682)

* Estimated Age at Release (columns in table) total to 100%
18. Gender* Parsed by Age (n = 29,111)

* Gender (columns in table) total to 100%
19. Race* Parsed by Age (n = 28,860)

* Race (columns in table) total to 100%
20. Effectively Eligible by Law to Receive Earned Sentence Credits* Parsed by Age (n = 29,111)

* Effectively Eligible by Law to Receive Earned Sentence Credits (columns in table) total to 100%
21. Estimated Time Until Release* Parsed by Age (n = 28,953)

* Estimated Time Until Release (columns in table) total to 100%
Section Four: Detailed Profile of Incarcerated People by Estimated Age at Custody
Estimated Age at Custody represents the age of an incarcerated person when they were likely taken into custody for their holding offense. The term ‘Estimated Age at Custody’ is used interchangeably with ‘Estimated Age at Time of Offense.’
The graph that follows illustrates the estimated age of people at custody/time of offense, grouped into categories, for the entire IDOC prison population as of December 31, 2021. It is identical to graph 2 above and is to be used as reference for comparisons between the size of these groups across the IDOC prison population versus the size of these groups within the categories included in the graphs within this section.
Estimated Age at Custody (n = 29,111)

Demographic Characteristics of Incarcerated People Parsed by Estimated Age at Custody (represented by colored sections within bars)
22. Age of Incarcerated People as of 12/31/20* Parsed by Estimated Age at Custody (n= 29,111)

* Age of Incarcerated People as of December 31, 2020 (columns in table) total to 100%
Of the people included in the cohort who are 65 or older, 58.08% were 50 or older when they committed their holding offense and 8.65% were 29 or younger when they committed their holding offense. Of the largest age cohort (30 – 35), approximately two-thirds (67.84%) were 25 to 35 years old when they committed their holding offense. Of the youngest age cohort (18 – 24), the majority (86.71%) were 18 to 24 years old when they committed their holding offense. The remainder (13.29%) of the 18-24 cohort were 17 or younger when they committed their holding offense.
23. Estimated Age at Release* Parsed by Estimated Age at Custody (n = 28,682)
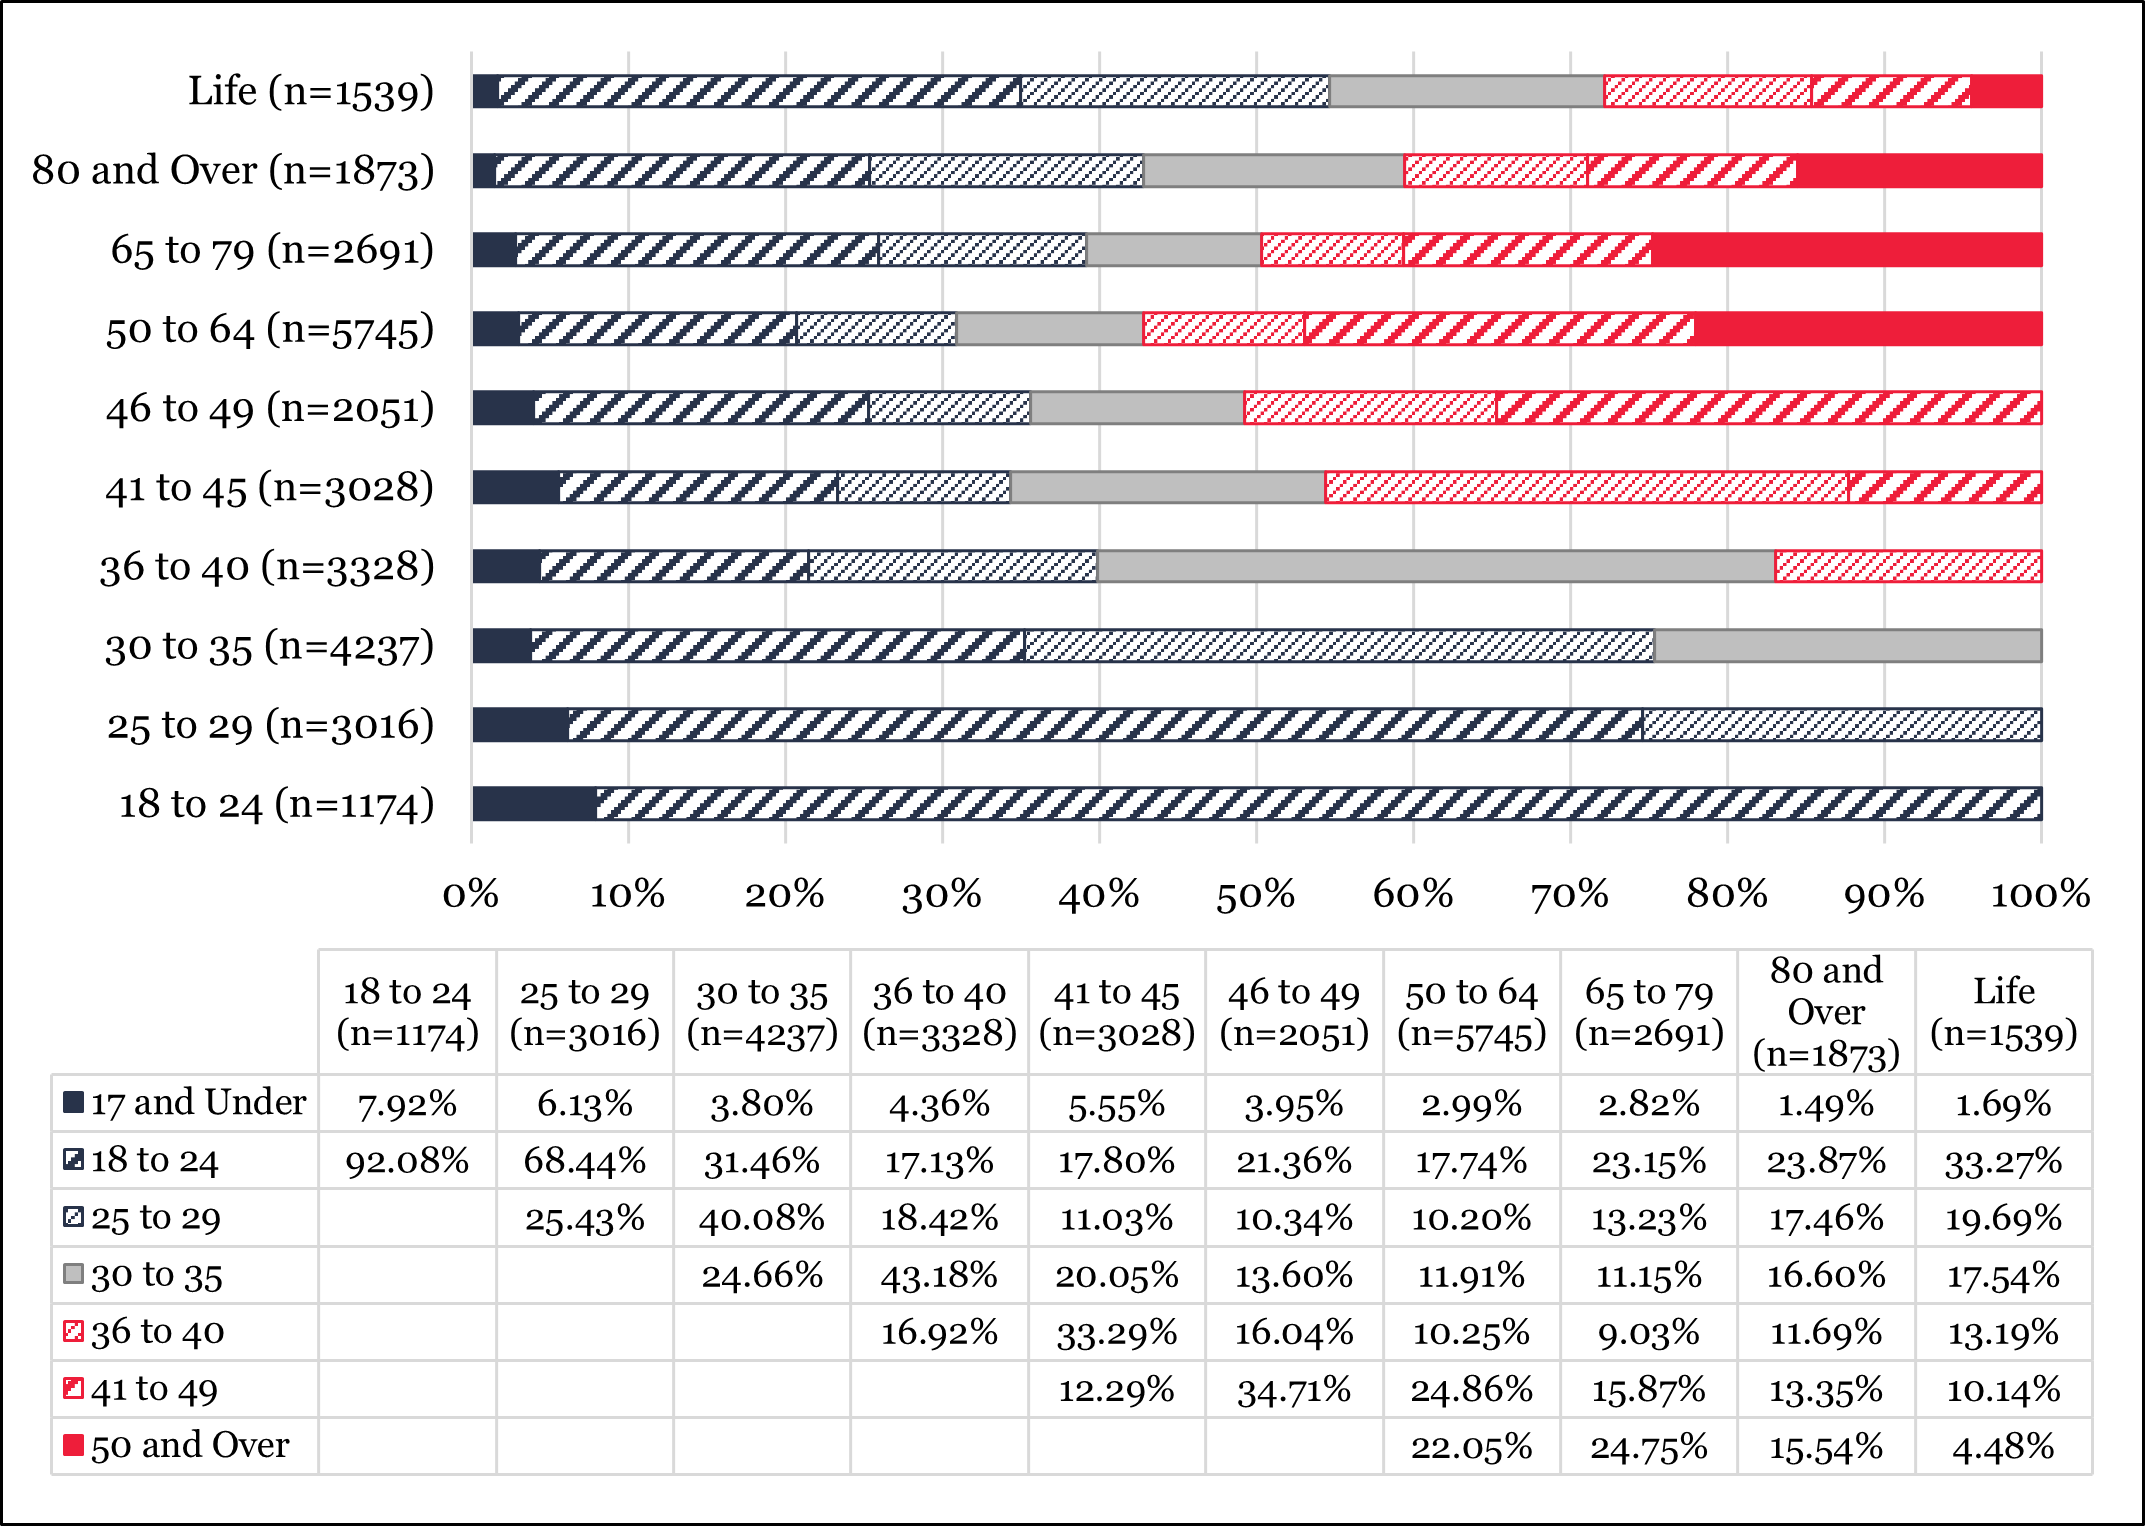
* Estimated Age at Release (columns in table) total to 100%
Nearly half (48.04%) of people were 18 to 29 years old when they committed/were taken into custody for their holding offense. Of the people who will be 65 or older upon release, over one-fifth (23.45%) were 18 to 24 at time of offense/custody. Of the people serving a life sentence who will never leave prison, one-third (33.27%) were 18 to 24 at time of offense/custody. Of the people who will be 80 or older upon release, 17.46% were 25 to 29 at time of offense/custody. Nearly one-fifth (19.69%) of people sentenced to life in prison were 25 to 29 at time of offense/custody.
The following two graphs provide a detailed breakdown of estimated age at release for the largest two cohorts of people for “Estimated Age at Custody,” the ‘18 to 23’ and ‘24 to 29’ estimated age at custody groups.
23a. Estimated Age at Release for Incarcerated People who Committed a Holding Offense between the Age of 18 and 24* (n = 8,626)

* Some people in the “Estimated Age at Custody: 18 to 24” group (n = 108) are not included because IDOC does not list a projected release date for them.
Of the group of people who are imprisoned for a holding offense committed when they were 18 to 24 years old, 29.29% will be released from prison when they are 46 or older, meaning that at a minimum, they will serve over two decades in prison prior to release. Additionally, 5.94% of people who are estimated to have committed their holding offense at age 18 to 24 will serve the remainder of their life in prison.
23b. Estimated Age at Release for Incarcerated People who Committed a Holding Offense between the Age of 25 and 29* (n = 5,196)

* Some people in the “Estimated Age at Custody: 25 to 29” group (n = 56) are not included because IDOC does not list a projected release date for them.
Of the group of incarcerated people who are imprisoned for a holding offense committed when they were 25 to 29 years old, 28.50% will be released from prison when they are 46 or older, meaning that at a minimum, they will serve 16 years in prison prior to release. Additionally, 5.83% of people who are estimated to have committed their holding offense at age 25 to 29 will serve the remainder of their life in prison.
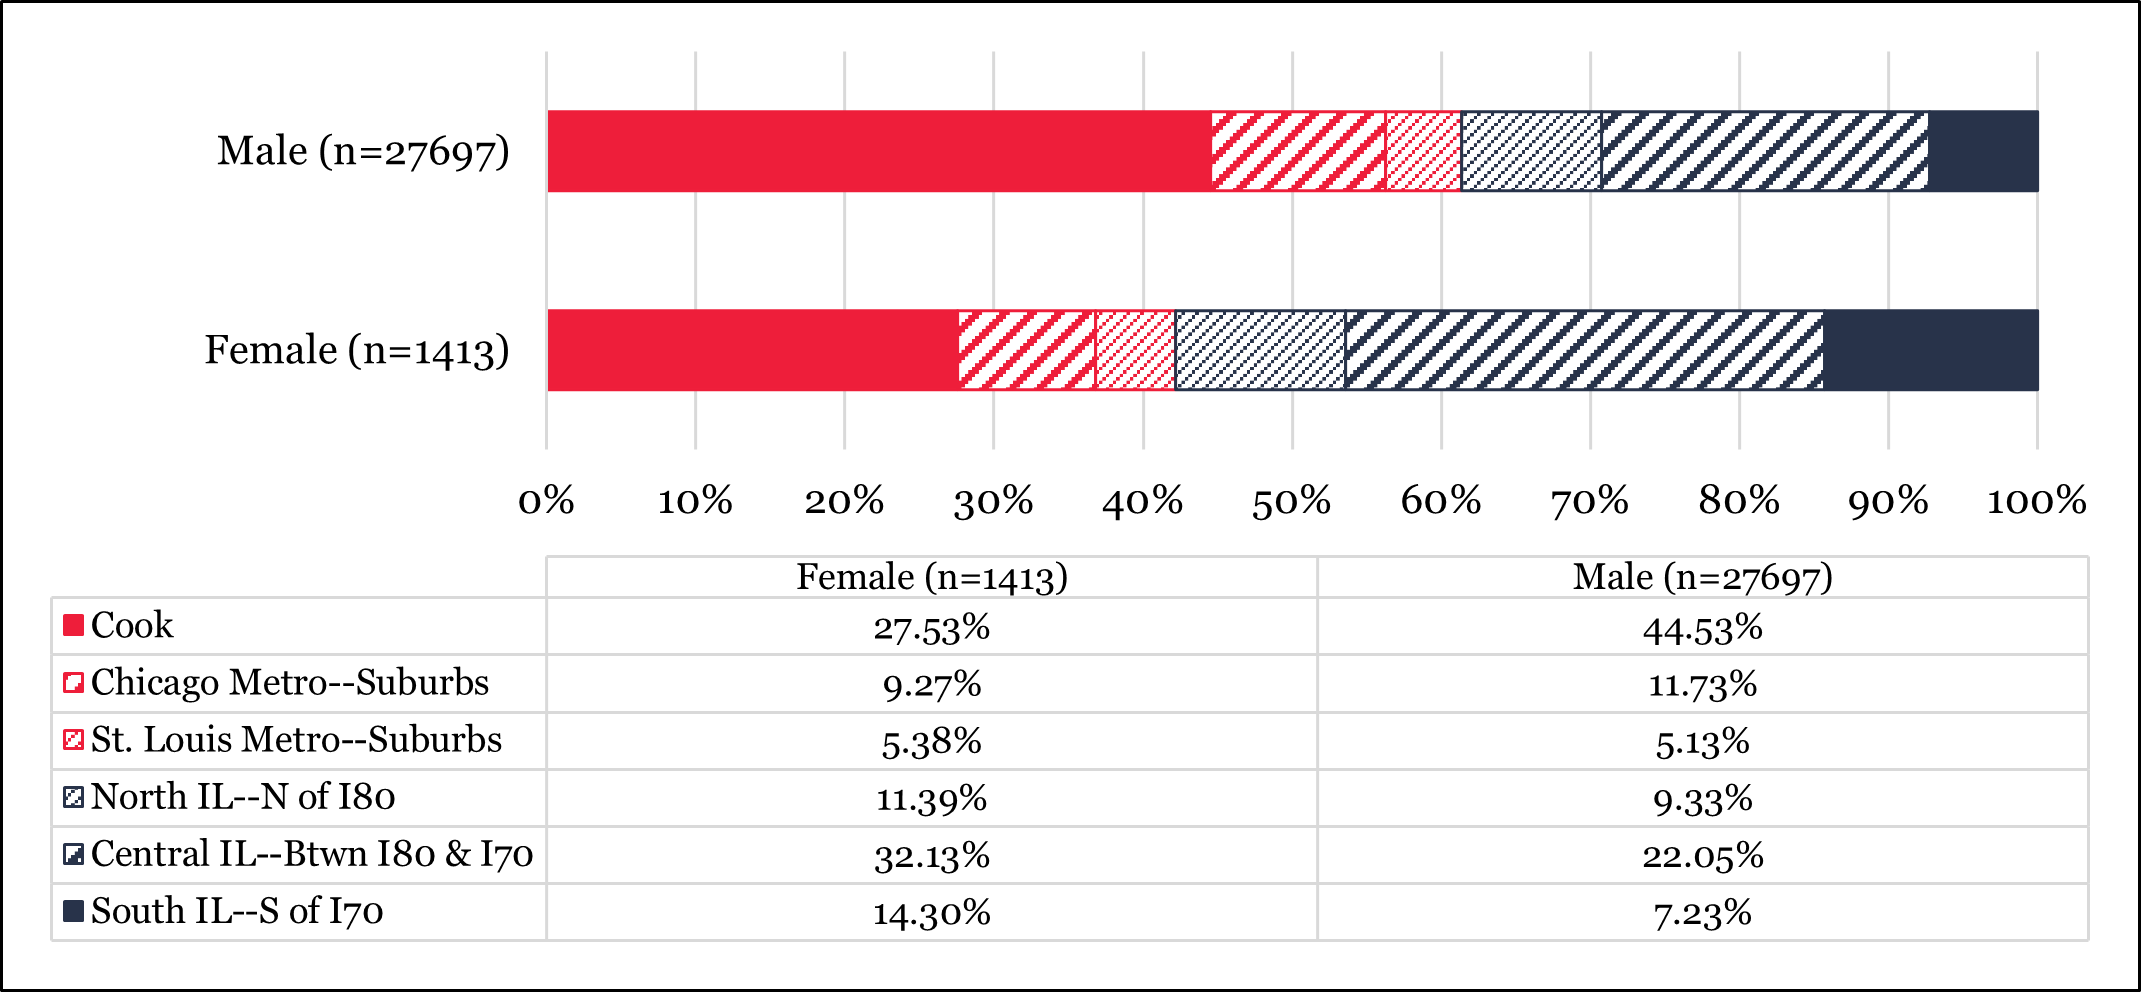
24. Gender* Parsed by Estimated Age at Custody (n = 29,111)

* Gender (columns in table) total to 100%
The graph above indicates that the proportion of males who were 24 or younger at time of offense/custody is significantly higher than the proportion of females who were 24 or younger at time of offense/custody. However, this dynamic shifts for the three age at offense/custody groups of ‘25 to 29,’ ‘30 to 35,’ ‘36 to 40,’ and ‘41 to 49,’ where the proportion of females are higher than the male counterparts. The proportion of males and females who committed their holding offense at age 50 or older are nearly equal.
25. Race* Parsed by Estimated Age at Custody (n = 28,860)

* Race (columns in table) total to 100%
The graph above illustrates substantial disparities in the age at offense/custody between Whites and non-Whites. 59.81% of Black incarcerated people were 29 or younger at time of offense/custody, and most (68.50%) of these people were 24 or younger. The figures are similar for the Hispanic incarcerated population. Of Hispanics, 56.53% were 29 or younger at time of offense/custody, and most (69.15%) of these people were 24 or younger. In comparison, a much smaller proportion (36.73%) of incarcerated people who are White were 29 or younger at time of offense/custody, and over half (54.15%) of these were 24 or younger. These figures should be contemplated with the fact that approximately half of IDOC’s prison population (52.04%) was 29 or younger at time of custody/offense in mind.
The disparity in in age at offense/custody between Whites and non-Whites reverses for people who were 30 or older than at time of offense/custody. Of people who identified as White, 42.55% were 36 or older at time of offense/custody, and nearly two-thirds (65.99%) were 41 or older. In comparison, a much smaller proportion of Black (24.64%) and Hispanic (28.25%) people were 36 or older at time of offense/custody. The proportion of Whites who were over 50 at time of offense/offense is nearly double the proportion of Blacks and Hispanics who were over 50 at time of offense/custody.
Legal Characteristics of Incarcerated People Parsed by Estimated Age at Custody (represented by colored sections within bars)
26. Admission Type—Recidivism* Parsed by Estimated Age at Custody (n = 29,111)

* Admission Type—Recidivism (columns in table) total to 100%
Of the four JHA recidivism categories, ‘First IDOC Sentence’ has the highest proportion (64.28%) of people who were 29 or younger at time of offense/custody, and the majority (76.17%) were 24 or younger. Of people who are serving a second or subsequent IDOC sentence, two-fifths (41.09%) were 29 or younger at time of offense/custody, and 49.19% were 24 or younger.
27. JHA Offense Type* Parsed by Estimated Age at Custody (n = 29,111)

* JHA Offense Type (columns in table) total to 100%
The proportion of incarcerated people who were 29 or younger at time of offense/custody is very high for ‘Person’ and ‘Firearm/Weapon’ offenses relative to the other JHA offense type categories. These figures should be contemplated keeping in mind that the majority (60.14%) of holding offenses is a ‘Person’ or ‘Firearm/Weapons’ offense type.
Of people whose holding offense is classified by JHA as being a person offense resulting in death or physical injury, the majority (69.81%) were 29 or younger at time of offense/custody, and most (72.86%) were 24 or younger. Of the people whose holding offense is classified by JHA as being a person offense where it is unclear that the offense resulted in death or physical injury, the majority (60.58%) were 29 or younger at time of offense/custody, and most (70.19%) were 24 or younger. Of the people whose holding offense is classified by JHA as being a firearm/weapons offense, over half (55.12%) were 29 or younger at time of offense/custody, and over half (51.54%) were 24 or younger. In comparison, the proportion of people who were 29 or younger at time of offense/custody whose holding offense is classified by JHA to be a sex, property, or drug offense does not exceed 36% for any category, and the proportion who were 24 or younger and imprisoned for such offenses does not exceed 25%.
Of the people whose holding offense is classified by JHA to be a person or firearm/weapon offense and were 24 or younger at time of offense/custody (n = 7,911), most (60.7%) were sentenced in Cook County.
Of the people whose holding offense is classified by JHA as being a sex offense, the majority (64.25%) were 30 or older at time of offense/custody, and over one-fifth (22.35%) were 50 or older at time of offense/custody.
28. Felony Class of Holding Offense* Parsed by Estimated Age at Custody (n = 28,951)

* Felony Class of Holding Offense (columns in table) total to 100%
Of the people whose felony class of holding offense is murder (Class M), the majority (72.35%) were 29 or younger at time of offense/custody, and most (74.18%) were 24 or younger. Also, of people whose felony class of holding offense is murder, 8.84% were 17 or younger at time of offense/custody.
Of the people whose felony class of holding offense is Class X (35.90% of IDOC’s population), over half (53.67%) were 29 or younger at time of offense/custody, and the majority (67.47%) were 24 or younger at time of offense/custody. 501 people, 4.79% of those whose felony class of holding offense is Class X, were 17 or younger at time of offense/custody.
29. Length of Court-Imposed Prison Sentence for Holding Offense* Parsed by Estimated Age at Custody (n = 27,414)

* Length of Court-Imposed Prison Sentence for Holding Offense (columns in table) total to 100%
30. Estimated Length of Court-Imposed Prison Sentence for Holding Offense After “Truth in Sentencing” Multiplier Applied* Parsed by Estimated Age at Custody (n = 27,414)

* Estimated Length of Court-Imposed Prison Sentence for Holding Offense After “Truth in Sentencing” Multiplier Applied (columns in table) total to 100%
31. Subject to “Truth in Sentencing” for Holding Offense* Parsed by Estimated Age at Custody (n = 28,953)

* Subject to “Truth in Sentencing” for Holding Offense (columns in table) total to 100%
32. Effectively Eligible by Law to Receive Earned Sentence Credits for Holding Offense* Parsed by Estimated Age at Custody (n = 29,111)

* Effectively Eligible by Law to Receive Earned Sentence Credits for Holding Offense (columns in table) total to 100%
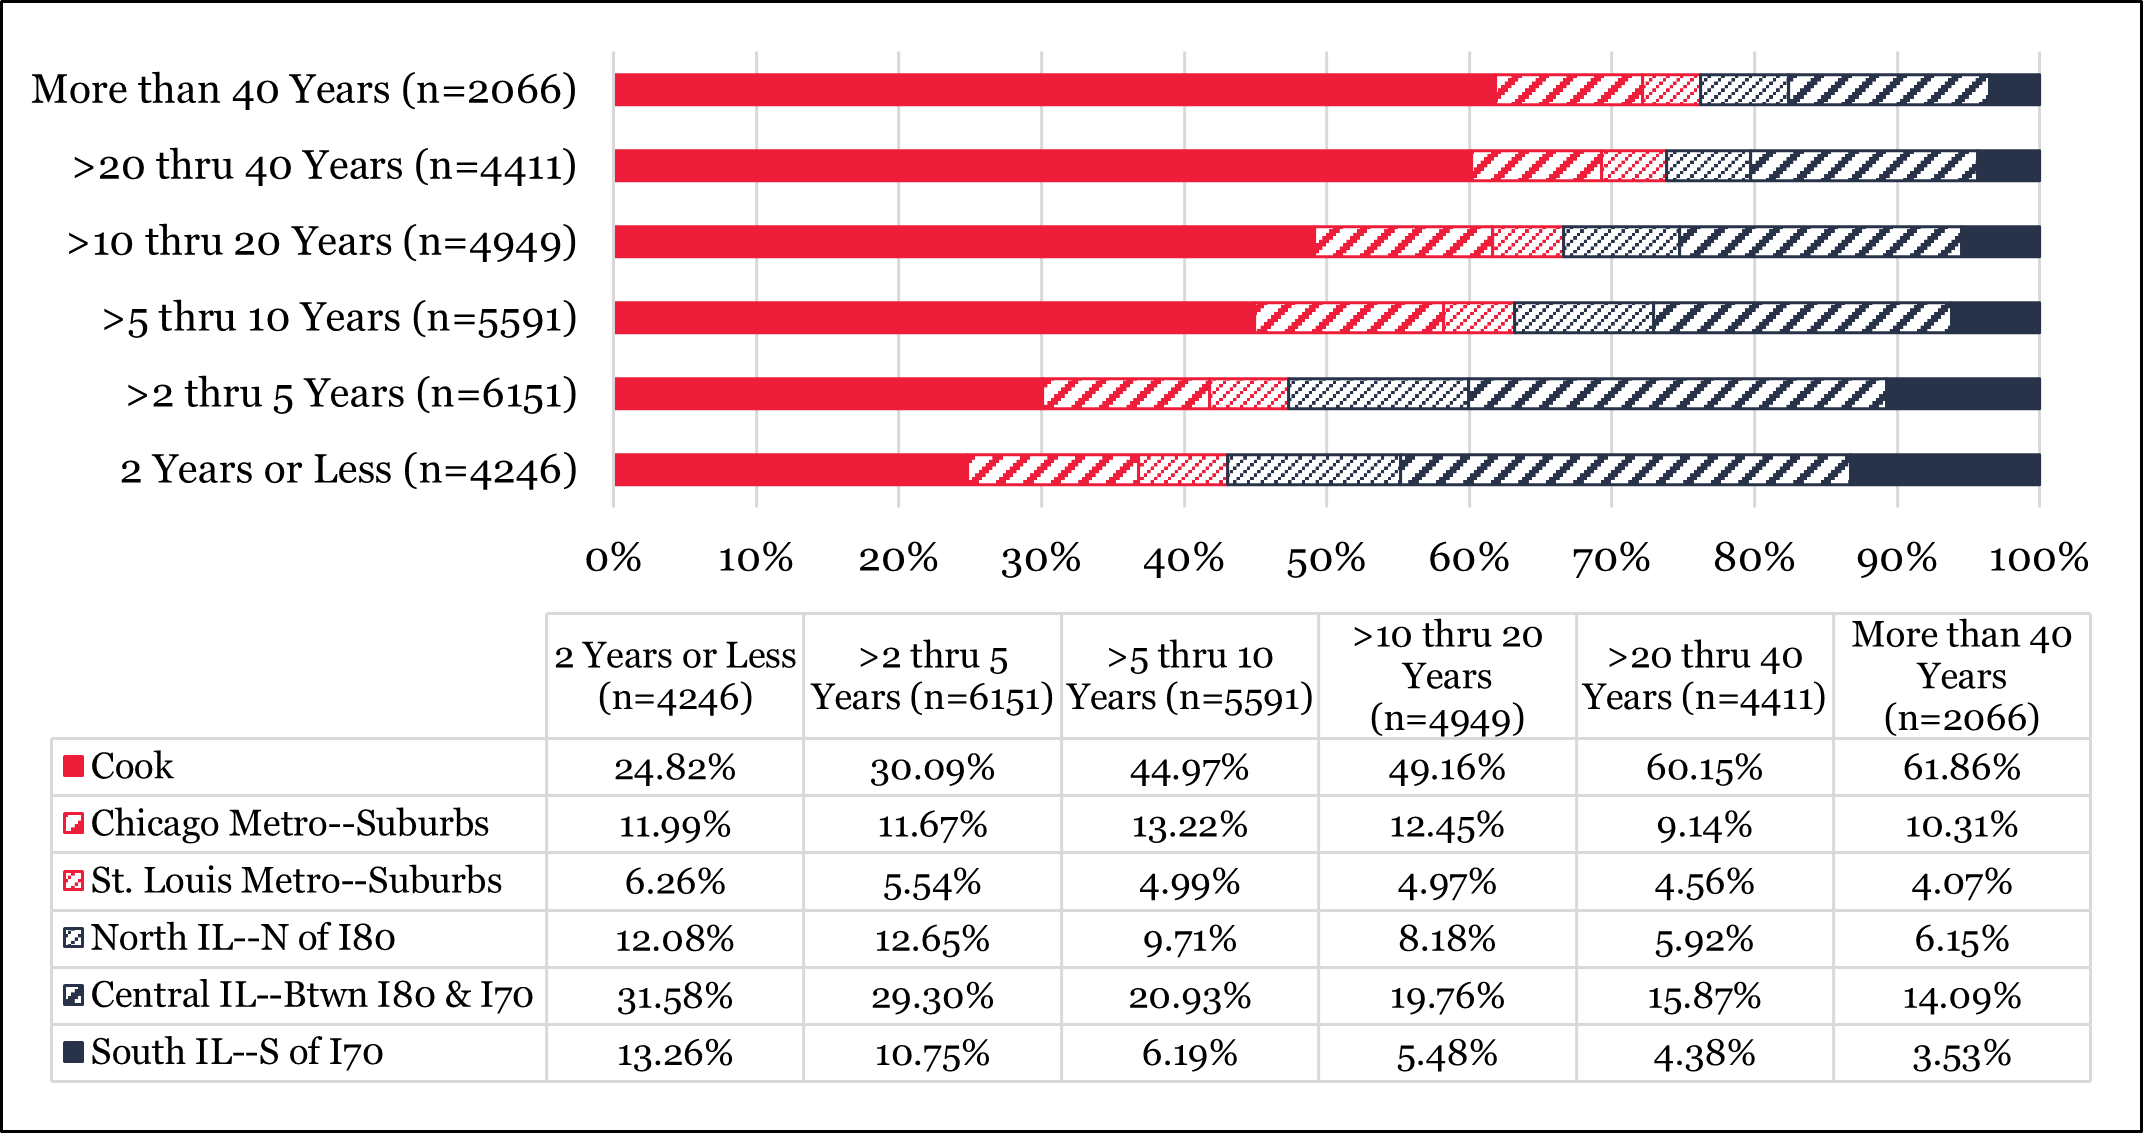
33. County Where a Person was Sentenced for Holding Offense—Regional* Parsed by Estimated Age at Custody (n = 29,110)

* County Where a Person was Sentenced for Holding Offense—Regional (columns in table) total to 100%
Section Five: Detailed Profile of Incarcerated People by Race
There are more racial identity values in the IDOC Prison Population data set dated 12/31/20 than are represented by the JHA “Race” variable. We condensed the following racial identities into a single ‘Other’ category (n = 251), as the percentage of IDOC’s population represented by each is close to zero-percent: American Indian, Asian, Bi-Racial, and Unknown. When generating bivariate tables and graphs presented in this profile, JHA does not use the ‘Other’ category due to the small number of incarcerated people counted as ‘Other’ and the values included in ‘Other’ are unrelated.
To compare the racial composition of IDOC’s prison population to the racial categories represented within the graphs within this section, the racial composition of IDOC’s prison population with the ‘Other’ category excluded (n = 28,860) is as follows:

Demographic Characteristics of Incarcerated People Parsed by Race (represented by colored sections within bars)
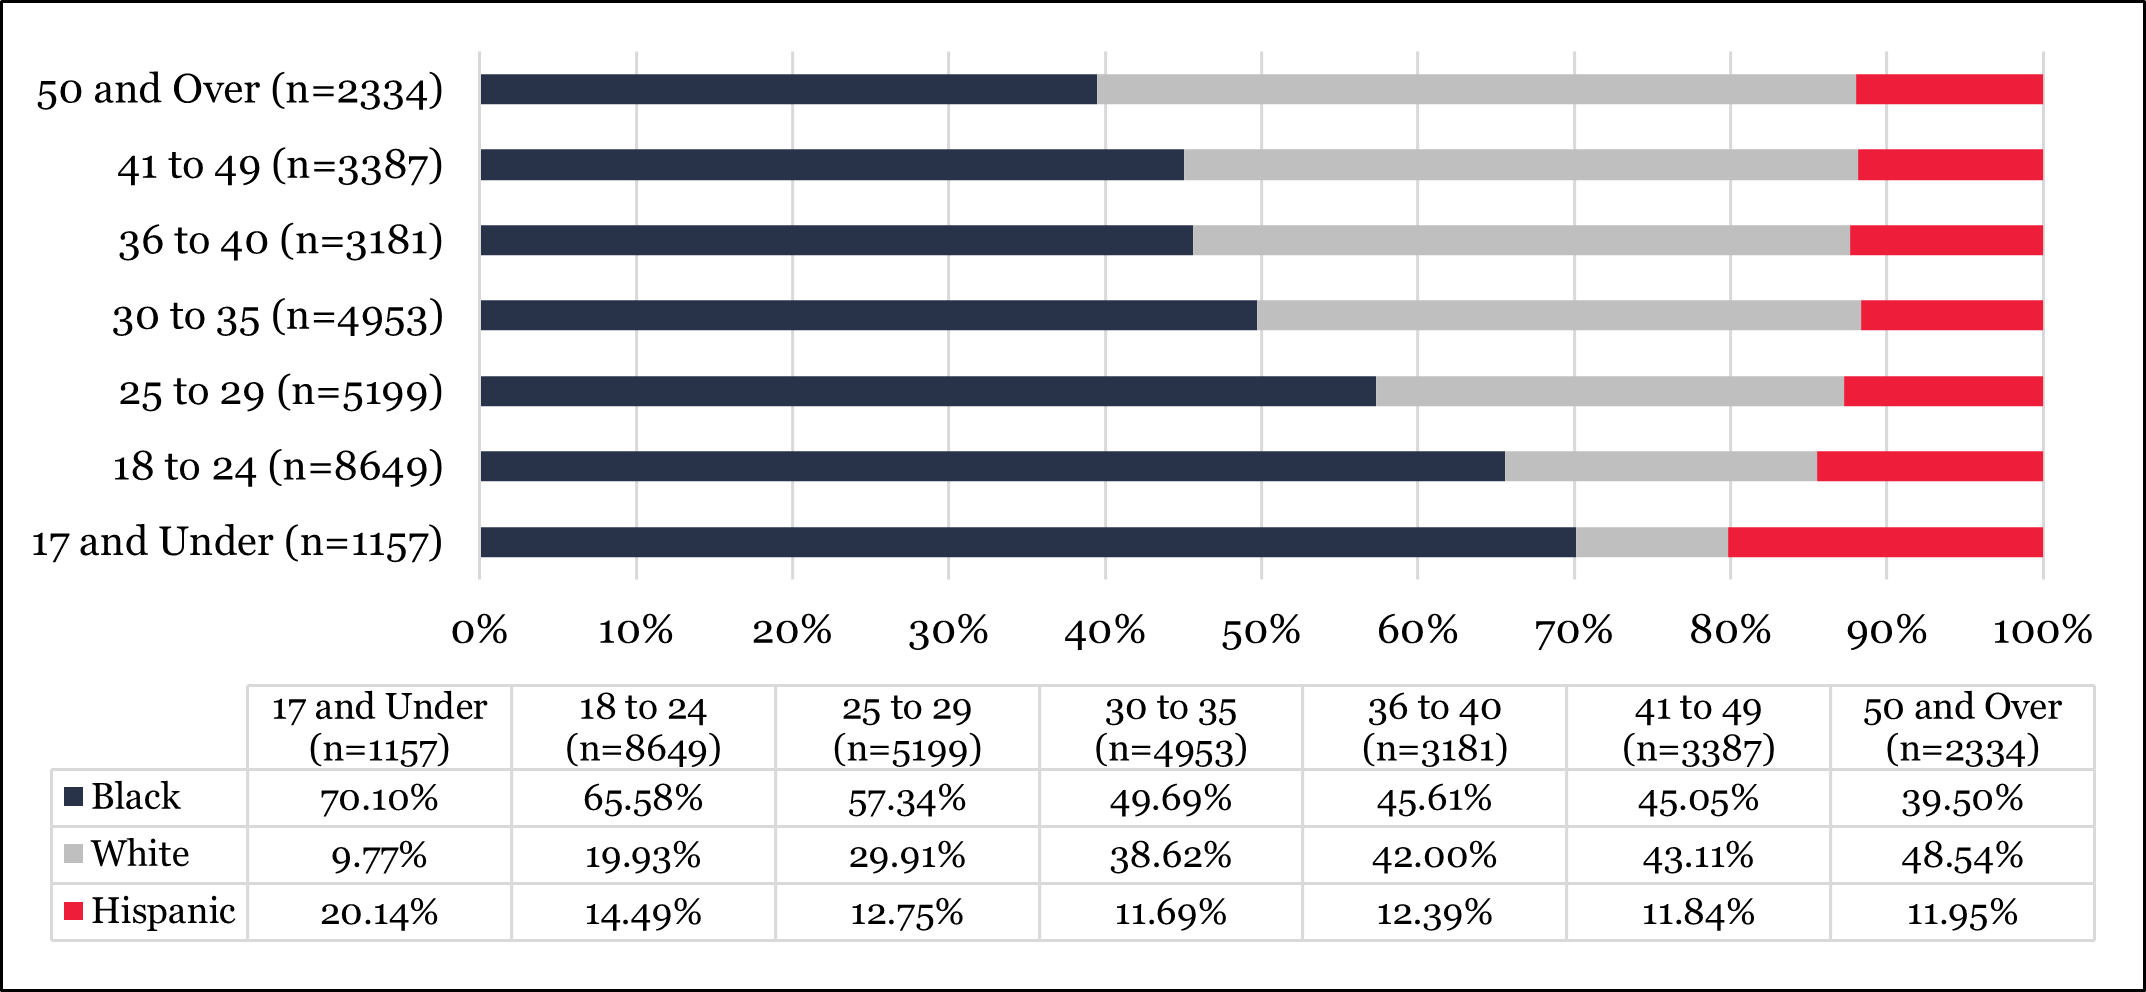
34. Age of Incarcerated People as of December 31, 2020* Parsed by Race (n = 28,860)

* Age of Incarcerated People as of December 31, 2020 (columns in table) total to 100%
35. Estimated Age at Custody* Parsed by Race (n = 28,860)
* Estimated Age at Custody (columns in table) total to 100%
36. Estimated Age at Release* Parsed by Race (n = 28,436)

* Estimated Age at Release (columns in table) total to 100%
37. Gender* Parsed by Race (n = 28,860)

* Gender (columns in table) total to 100%
Legal Characteristics of Incarcerated People Parsed by Race (represented by colored sections within bars)
38. Admission Type—Recidivism* Parsed by Race (n = 28,860)

* Admission Type—Recidivism (columns in table) total to 100%
39. JHA Offense Type* Parsed by Race (n = 28,860)

* JHA Offense Type (columns in table) total to 100%
40. Felony Class of Holding Offense* Parsed by Race (n = 28,701)

* Felony Class of Holding Offense (columns in table) total to 100%
41. Length of Court-Imposed Prison Sentence for Holding Offense* Parsed by Race (n = 27,171)
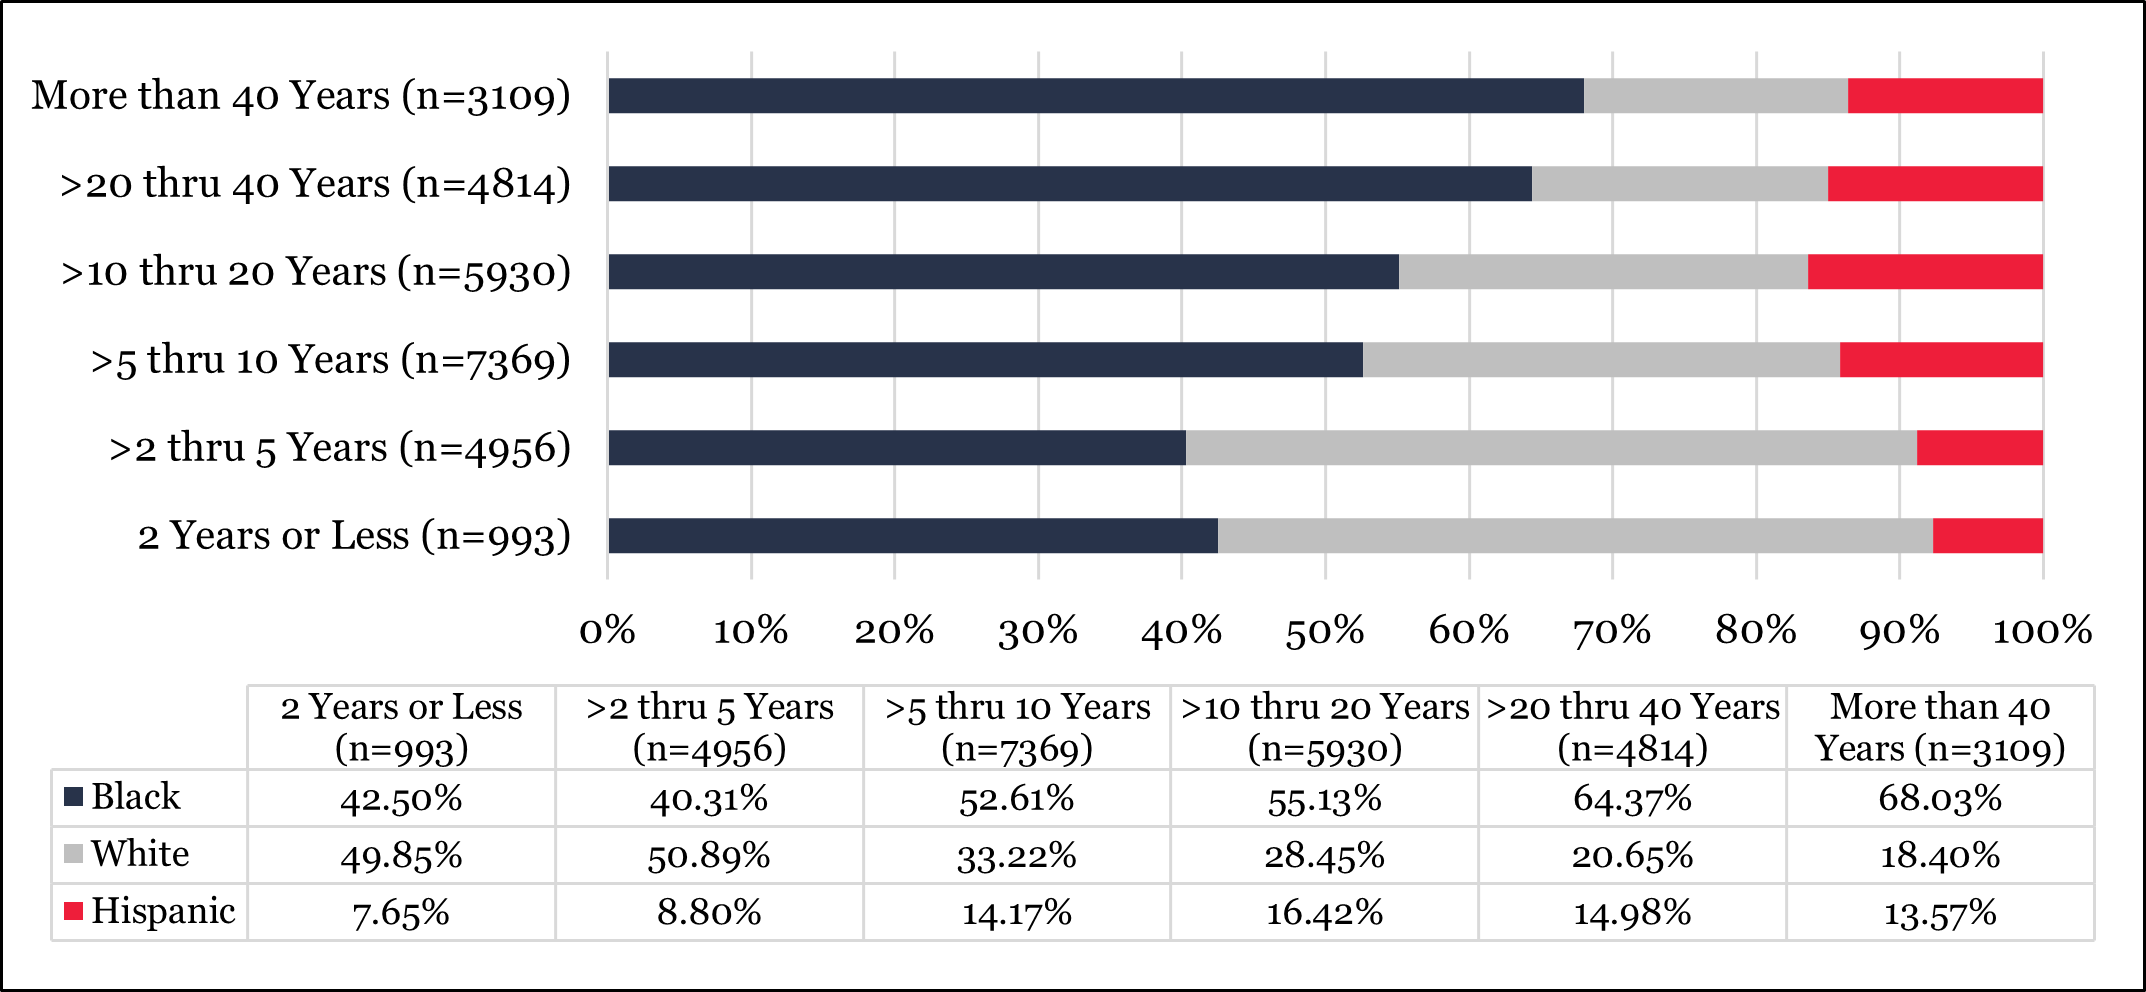
* Length of Court-Imposed Prison Sentence for Holding Offense (columns in table) total to 100%
42. Estimated Length of Court-Imposed Prison Sentence for Holding Offense after “Truth in Sentencing” Multiplier Applied* Parsed by Race (n = 27,167)

* Estimated Length of Court-Imposed Prison Sentence for Holding Offense After “Truth in Sentencing” Multiplier Applied (columns in table) total to 100%
43. Subject to “Truth in Sentencing” for Holding Offense* Parsed by Race (n = 28,703)

* Subject to “Truth in Sentencing” for Holding Offense (columns in table) total to 100%
44. Effectively Eligible by Law to Receive Earned Sentence Credits for Holding Offense* Parsed by Race (n = 28,860)

* Effectively Eligible by Law to Receive Earned Sentence Credits for Holding Offense (columns in table) total to 100%
45. County Where a Person was Sentenced for Holding Offense—Regional* Parsed by Race (n = 28,859)

* County Where a Person was Sentenced for Holding Offense—Regional (columns in table) total to 100%
Section Six: Detailed Profile of Incarcerated People by JHA Offense Type
Offense Type indicates the nature of the criminal offense listed as a person’s holding offense. JHA and IDOC do not use a uniform definition for offense types, for IDOC possesses more information about incarcerated people and the criminal offenses that resulted in their incarceration than is made available to the public in the IDOC population data sets. JHA classifies criminal offenses by offense type using the plain language of the statute describing each offense and court findings (example: court finding of great bodily harm). For a description of each JHA Offense Type, see this methodology document.
The graph immediately following this paragraph illustrates the offense type of people’s holding offenses, grouped into categories, for the entire IDOC prison population as of 12/31/21. It is to be used as reference for comparisons between the size of these groups across the IDOC prison population versus the size of these groups within the categories included in the graphs within this section. The reference graph below is identical to graph 8 above.
JHA Offense Type of Holding Offense* (n = 29,111)

* Categories within the above graph were created by JHA using individual offenses as listed within the IDOC data set. A listing of individual offenses included within each JHA created offense type can be found here.
Demographic Characteristics of Incarcerated People Parsed by JHA Offense Type (represented by colored sections within bars)
46. Age of Incarcerated People as of December 31, 2020* Parsed by JHA Offense Type (n = 29,111)

* Age of Incarcerated People as of December 31, 2020 (columns in table) total to 100%
47. Estimated Age at Custody* Parsed by JHA Offense Type (n = 29,111)

* Estimated Age at Custody (columns in table) total to 100%
48. Estimated Age at Release* Parsed by JHA Offense Type (n = 28,682)

* Estimated Age at Release (columns in table) total to 100%
49. Gender* Parsed by JHA Offense Type (n = 29,111)

* Gender (columns in table) total to 100%
50. Race Parsed by JHA Offense Type (n = 28,860)

* Race (columns in table) total to 100%
Legal Characteristics of Incarcerated People Parsed by JHA Offense Type (represented by colored sections within bars)
51. Admission Type—Recidivism* Parsed by JHA Offense Type (n = 29,111)

* Admission Type—Recidivism (columns in table) total to 100%
52. Felony Class of Holding Offense* Parsed by JHA Offense Type (n = 28,951)

* Felony Class of Holding Offense (columns in table) total to 100%
53. Length of Court-Imposed Prison Sentence for Holding Offense Parsed by JHA Offense Type (n = 27,414)

* Length of Court-Imposed Prison Sentence for Holding Offense (columns in table) total to 100%
54. Estimated Length of Court-Imposed Prison Sentence for Holding Offense after “Truth in Sentencing” Multiplier Applied* Parsed by JHA Offense Type (n = 27,414)

* Estimated Length of Court-Imposed Prison Sentence for Holding Offense After “Truth in Sentencing” Multiplier Applied (columns in table) total to 100%
55. Subject to “Truth in Sentencing” for Holding Offense* Parsed by JHA Offense Type (n = 28,953)

* Subject to “Truth in Sentencing” for Holding Offense (columns in table) total to 100%
56. Effectively Eligible by Law to Receive Earned Sentence Credits for Holding Offense* Parsed by JHA Offense Type (n = 29,111)
* Effectively Eligible by Law to Receive Earned Sentence Credits for Holding Offense (columns in table) total to 100%
57. Estimated Time Until Release* Parsed by JHA Offense Type (n = 28,953)

* Estimated Time Until Release (columns in table) total to 100%
58. County Where a Person was Sentenced for Holding Offense—Regional* Parsed by JHA Offense Type (n = 29,110)

* County Where a Person was Sentenced for Holding Offense—Regional (columns in table) total to 100%
Section Seven: Detailed Profile of Incarcerated People by County Where a Person was Sentenced for Holding Offense (Regional)
County Where a Person was Sentenced for Holding Offense—Regional reflects the region within Illinois where a person was sentenced for their holding offense. A list of counties by region can be found here.
The graph immediately following this paragraph illustrates the county where people were sentenced for their holding offense, grouped into categories, for the entire IDOC prison population as of December 31, 2021. It is identical to graph 15 above and is to be used as reference for comparisons between the size of these groups across the IDOC prison population versus the size of these groups within the categories included in the graphs within this section.
County Where a Person was Sentenced for Holding Offense—Regional* (n = 29,110)

* One person whose sentencing county was listed as ‘out of state’ by IDOC is not included in the graph above.
Demographic Characteristics of Incarcerated People Parsed by County Where a Person was Sentenced for Holding Offense—Regional (represented by colored sections within bars)
59. Age of Incarcerated People as of December 31, 2020* Parsed by County Where a Person was Sentenced for Holding Offense—Regional (n = 29,110)

* Age of Incarcerated People as of December 31, 2020 (columns in table) total to 100%
60. Estimated Age at Custody* Parsed by County Where a Person was Sentenced for Holding Offense—Regional (n = 29,110)

* Estimated Age at Custody (columns in table) total to 100%
61. Estimated Age at Release* Parsed by County Where a Person was Sentenced for Holding Offense—Regional (n = 28,681)

* Estimated Age at Release (columns in table) total to 100%
62. Gender* Parsed by County Where a Person was Sentenced for Holding Offense—Regional (n = 29,110)
* Gender (columns in table) total to 100%
63. Race* Parsed by County Where a Person was Sentenced for Holding Offense—Regional (n = 28,859)

* Race (columns in table) total to 100%
Legal Characteristics of Incarcerated People Parsed by County Where a Person was Sentenced for Holding Offense—Regional (represented by colored sections within bars)
64. Admission Type—Recidivism* Parsed by County Where a Person was Sentenced for Holding Offense—Regional (n = 29,110)

* Admission Type—Recidivism (columns in table) total to 100%
65. JHA Offense Type* Parsed by County Where a Person was Sentenced for Holding Offense—Regional (n = 29,110)

* JHA Offense Types (columns in table) total to 100%
66. Felony Class of Holding Offense* Parsed by County Where a Person was Sentenced for Holding Offense—Regional (n = 28,950)

* Felony Class of Holding Offense (columns in table) total to 100%
67. Length of Court-Imposed Prison Sentence for Holding Offense* Parsed by County Where a Person was Sentenced for Holding Offense—Regional (n = 27,414)

* Length of Court-Imposed Prison Sentence for Holding Offense (columns in table) total to 100%
68. Estimated Length of Court-Imposed Prison Sentence for Holding Offense After “Truth in Sentencing” Multiplier Applied* Parsed by County Where a Person was Sentenced for Holding Offense—Regional (n = 27,414)
* Estimated Length of Court-Imposed Prison Sentence for Holding Offense After “Truth in Sentencing” Multiplier Applied (columns in table) total to 100%
69. Subject to “Truth in Sentencing” for Holding Offense* Parsed by County Where a Person was Sentenced for Holding Offense—Regional (n = 28,952)

* Subject to “Truth in Sentencing” for Holding Offense (columns
70. Effectively Eligible by Law to Receive Earned Sentence Credits for Holding Offense Parsed by County Where a Person was Sentenced for Holding Offense—Regional (n = 29,110)

* Effectively Eligible by Law to Receive Earned Sentence Credits for Holding Offense (columns in table) total to 100%
71. Estimated Time Until Release* Parsed by County Where a Person was Sentenced for Holding Offense—Regional (n = 29,110)

* Estimated Time Until Release (columns in table) total to 100%
Section Eight: Detailed Profile of Incarcerated People by Estimated Length of Court-Imposed Prison Sentence for Holding Offense after “Truth in Sentencing” Multiplier is Applied
Estimated Length of Court-Imposed Prison Sentence for Holding Offense After “Truth in Sentencing” Multiplier Applied is calculated by multiplying JHA’s “Length of Court-Imposed Prison Sentence for Holding Offense” variable by IDOC’s “Truth in Sentencing” variable after it is converted into a numerical value. A person may be required to serve 100%, 85%, 75%, or 50% of their court-imposed prison sentence; this is determined by law based on the holding offense (see 730 ILCS 5/3-6-3). Thus, the multipliers are 1, .85, .75, and .5 respectively.
The graph immediately following this paragraph illustrates the estimated length of the court-imposed prison sentence for a person’s holding offense after the “Truth in Sentencing” multiplier was applied, grouped into categories, for the entire IDOC prison population as of December 31, 2021. It is identical to graph 11 above and is to be used as reference for comparisons between the size of these groups across the IDOC prison population versus the size of these groups within the categories included in the graphs within this section.
Estimated Length of Court-Imposed Prison Sentence for Holding Offense After “Truth in Sentencing” Multiplier Applied (n = 28,953)

Demographic Characteristics of Incarcerated People Parsed by Estimated Length of Court-Imposed Prison Sentence for Holding Offense After “Truth in Sentencing” Multiplier Applied (represented by colored sections within bars)
72. Age of Incarcerated People as of December 31, 2020* Parsed by Estimated Length of Court-Imposed Prison Sentence for Holding Offense After “Truth in Sentencing” Multiplier Applied (n = 28,953)

* Age of Incarcerated People as of December 31, 2020 (columns in table) total to 100%
73. Estimated Age at Custody* Parsed by Estimated Length of Court-Imposed Prison Sentence for Holding Offense After “Truth in Sentencing” Multiplier Applied (n = 28,953)

* Estimated Age at Custody (columns in table) total to 100%
74. Estimated Age at Release* Parsed by Estimated Length of Court-Imposed Prison Sentence for Holding Offense After “Truth in Sentencing” Multiplier Applied (n = 27,682)**

* Estimated Age at Release (columns in table) total to 100%
** People who are serving a life sentence are not included in this graph and table, as 100% do not have a release date.
75. Gender* Parsed by Estimated Length of Court-Imposed Prison Sentence for Holding Offense After “Truth in Sentencing” Multiplier Applied (n = 28,953)

* Gender (columns in table) total to 100%
76. Race* Parsed by Estimated Length of Court-Imposed Prison Sentence for Holding Offense After “Truth in Sentencing” Multiplier Applied (n = 28,703)

* Race (columns in table) total to 100%
Legal Characteristics of Incarcerated People Parsed by Estimated Length of Court-Imposed Prison Sentence for Holding Offense After “Truth in Sentencing” Multiplier Applied (represented by colored sections within bars)
77. Admission Type—Recidivism* Parsed by Estimated Length of Court-Imposed Prison Sentence for Holding Offense After “Truth in Sentencing” Multiplier Applied (n = 28,953)

* Admission Type—Recidivism (columns in table) total to 100%
78. JHA Offense Type Parsed by Estimated Length of Court-Imposed Prison Sentence for Holding Offense After “Truth in Sentencing” Multiplier Applied (n = 28,953)

* JHA Offense Types (columns in table) total to 100%
79. Felony Class of Holding Offense* Parsed by Estimated Length of Court-Imposed Prison Sentence for Holding Offense After “Truth in Sentencing” Multiplier Applied (n = 28,951)

* Felony Class of Holding Offense (columns in table) total to 100%
80. Length of Court-Imposed Prison Sentence for Holding Offense* Parsed by Estimated Length of Court-Imposed Prison Sentence for Holding Offense After “Truth in Sentencing” Multiplier Applied (n = 27,414)**

* Length of Court-Imposed Prison Sentence for Holding Offense (columns in table) total to 100%
** People who are serving a life sentence are not included in this graph and table, as TIS does not affect a life sentence.
81. Subject to “Truth in Sentencing” for Holding Offense* Parsed by Estimated Length of Court-Imposed Prison Sentence for Holding Offense After “Truth in Sentencing” Multiplier Applied (n = 27,414)**

* Subject to “Truth in Sentencing” for Holding Offense (columns in table) total to 100%
** People who are serving a life sentence are not included in this graph and table, as TIS does not affect a life sentence.
82. Effectively Eligible by Law to Receive Earned Sentence Credits for Holding Offense* Parsed by Estimated Length of Court-Imposed Prison Sentence for Holding Offense After “Truth in Sentencing” Multiplier Applied (n = 28,953)

* Effectively Eligible by Law to Receive Earned Sentence Credits for Holding Offense (columns in table) total to 100%
83. Estimated Time Until Release* Parsed by Estimated Length of Court-Imposed Prison Sentence for Holding Offense After “Truth in Sentencing” Multiplier Applied (n = 27,414)**
* Estimated Time Until Release (columns in table) total to 100%
** People who are serving a life sentence are not included in this graph and table, as they will not be released.
84. County Where a Person was Sentenced for Holding Offense—Regional* Parsed by Estimated Length of Court-Imposed Prison Sentence for Holding Offense After “Truth in Sentencing” Multiplier Applied (n = 28,952)

* County Where a Person was Sentenced for Holding Offense—Regional (columns in table) total to 100%
Section Nine: Biannual Comparison of IDOC Prison Population 2010 – 2020
85. Age of Incarcerated People* as of December 31**

* Age of Incarcerated People as of December 31 by year (columns in table) total to 100%
** IDOC housed people age 17 and under prior to 2018; these people are not counted in the graph above.
86. Estimated Age at Custody*

* Estimated Age at Custody by year (columns in table) total to 100%
87. Gender*

* Gender by year (columns in table) total to 100%
88. Race*

* Race by year (columns in table) total to 100%
89. Admission Type—Recidivism*

* Admission Type—Recidivism by year (columns in table) total to 100%
90. JHA Offense Type of Holding Offense*

* JHA Offense Type of Holding Offense by year (columns in table) total to 100%
91. Felony Class of Holding Offense*

* Felony Class of Holding Offense by year (columns in table) total to 100%
92. Length of Court-Imposed Prison Sentence for Holding Offense*

* Length of Court-Imposed Prison Sentence for Holding Offense by year (columns in table) total to 100%
93. Estimated Length of Court-Imposed Prison Sentence for Holding Offense After “Truth in Sentencing” Multiplier Applied*

* Estimated Length of Court-Imposed Prison Sentence for Holding Offense After “Truth in Sentencing” Multiplier Applied by year (columns in table) total to 100%
94. Subject to “Truth in Sentencing” for Holding Offense*

* People Subject to “Truth in Sentencing” for Holding Offense by year (columns in table) total to 100%
95. County Where a Person was Sentenced for Holding Offense—Regional*

* County Where a Person was Sentenced for Holding Offense—Regional by year (columns in table) total to 100%
~subheadIndex-h3